
Page 262 - Vibrational Spectroscopic Imaging for Biomedical Applications
P. 262
238 Cha pte r Ei g h t
1451
1004 1255 1315 1339 1659
853 934 1064 1127 1210 1618
Raman Intensity 622 644 700 759 828 877 1158 1175 1555 1607
669 680 726 747 781 833 875 1094 1253 1303 1336 1368 1420 1482 1575 1670
700 900 1100 1300 1500 1700
–1
Raman Shift (cm )
(a)
100 μm
(b) (c)
−1
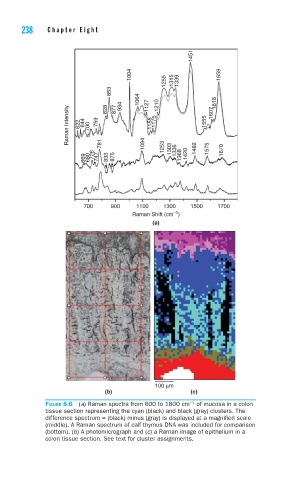
FIGURE 8.6 (a) Raman spectra from 600 to 1800 cm of mucosa in a colon
tissue section representing the cyan (black) and black (gray) clusters. The
difference spectrum = (black) minus (gray) is displayed at a magnifi ed scale
(middle). A Raman spectrum of calf thymus DNA was included for comparison
(bottom). (b) A photomicrograph and (c) a Raman image of epithelium in a
colon tissue section. See text for cluster assignments.