
Page 257 - Vibrational Spectroscopic Imaging for Biomedical Applications
P. 257
Raman Micr oscopy for Biomedical Applications 233
larger step size was sufficient to give an overview of the Raman
microspectroscopic features of each sample.
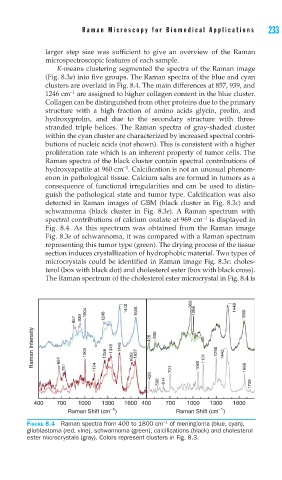
K-means clustering segmented the spectra of the Raman image
(Fig. 8.3a) into five groups. The Raman spectra of the blue and cyan
clusters are overlaid in Fig. 8.4. The main differences at 857, 939, and
−1
1246 cm are assigned to higher collagen content in the blue cluster.
Collagen can be distinguished from other proteins due to the primary
structure with a high fraction of amino acids glycin, prolin, and
hydroxyprolin, and due to the secondary structure with three-
stranded triple helices. The Raman spectra of gray-shaded cluster
within the cyan cluster are characterized by increased spectral contri-
butions of nucleic acids (not shown). This is consistent with a higher
proliferation rate which is an inherent property of tumor cells. The
Raman spectra of the black cluster contain spectral contributions of
−1
hydroxyapatite at 960 cm . Calcification is not an unusual phenom-
enon in pathological tissue. Calcium salts are formed in tumors as a
consequence of functional irregularities and can be used to distin-
guish the pathological state and tumor type. Calcification was also
detected in Raman images of GBM (black cluster in Fig. 8.3c) and
schwannoma (black cluster in Fig. 8.3e). A Raman spectrum with
−1
spectral contributions of calcium oxalate at 969 cm is displayed in
Fig. 8.4. As this spectrum was obtained from the Raman image
Fig. 8.3e of schwannoma, it was compared with a Raman spectrum
representing this tumor type (green). The drying process of the tissue
section induces crystallization of hydrophobic material. Two types of
microcrystals could be identified in Raman image Fig. 8.3e: choles-
terol (box with black dot) and cholesterol ester (box with black cross).
The Raman spectrum of the cholesterol ester microcrystal in Fig. 8.4 is
1004 1448 1656 969 1004 1448 1660
857 939 1246
Raman Intensity 661 1004 1258 1346 1449 1603 1657 426 508 1131 1298 1442
1124
751
428 701 1065 1669
538 614 1739
400 700 1000 1300 1600 400 700 1000 1300 1600
–1
–1
Raman Shift (cm ) Raman Shift (cm )
−1
FIGURE 8.4 Raman spectra from 400 to 1800 cm of meningioma (blue, cyan),
glioblastoma (red, vine), schwannoma (green), calcifi cations (black) and cholesterol
ester microcrystals (gray). Colors represent clusters in Fig. 8.3.