
Page 256 - Vibrational Spectroscopic Imaging for Biomedical Applications
P. 256
232 Cha pte r Ei g h t
15
14
reported for GBMs, meningiomas, and GBM, meningiomas and
16
16
schwannomas. The results were compared with FTIR images and
have been transferred to nondried brain tumors. 17
Dried Tissue Sections
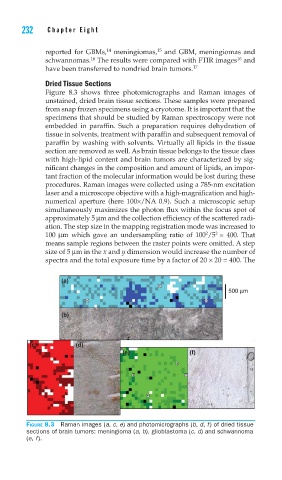
Figure 8.3 shows three photomicrographs and Raman images of
unstained, dried brain tissue sections. These samples were prepared
from snap frozen specimens using a cryotome. It is important that the
specimens that should be studied by Raman spectroscopy were not
embedded in paraffin. Such a preparation requires dehydration of
tissue in solvents, treatment with paraffin and subsequent removal of
paraffin by washing with solvents. Virtually all lipids in the tissue
section are removed as well. As brain tissue belongs to the tissue class
with high-lipid content and brain tumors are characterized by sig-
nificant changes in the composition and amount of lipids, an impor-
tant fraction of the molecular information would be lost during these
procedures. Raman images were collected using a 785-nm excitation
laser and a microscope objective with a high-magnification and high-
numerical aperture (here 100×/NA 0.9). Such a microscopic setup
simultaneously maximizes the photon flux within the focus spot of
approximately 5 μm and the collection efficiency of the scattered radi-
ation. The step size in the mapping registration mode was increased to
2
2
100 μm which gave an undersampling ratio of 100 /5 = 400. That
means sample regions between the raster points were omitted. A step
size of 5 μm in the x and y dimension would increase the number of
spectra and the total exposure time by a factor of 20 × 20 = 400. The
(a)
500 μm
(b)
(c) (d)
(e) (f)
FIGURE 8.3 Raman images (a, c, e) and photomicrographs (b, d, f) of dried tissue
sections of brain tumors: meningioma (a, b), glioblastoma (c, d) and schwannoma
(e, f).