
Page 253 - Vibrational Spectroscopic Imaging for Biomedical Applications
P. 253
Raman Micr oscopy for Biomedical Applications 229
1 mm
785 nm Laser Fiber Tracts
Cerebellum
Spectrograph CCD
Mesencephalon
EF CF Tumor
Cistern
x
BP LP
Ventricle
y
BS
M
(a)
(b) (c)
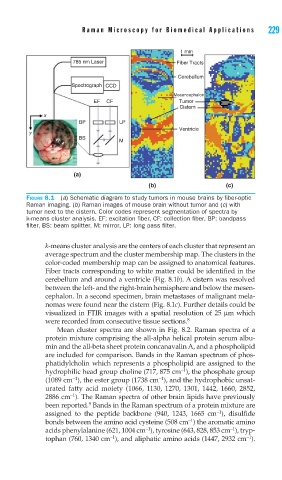
FIGURE 8.1 (a) Schematic diagram to study tumors in mouse brains by fi ber-optic
Raman imaging. (b) Raman images of mouse brain without tumor and (c) with
tumor next to the cistern. Color codes represent segmentation of spectra by
k-means cluster analysis. EF: excitation fi ber, CF: collection fi ber, BP: bandpass
fi lter, BS: beam splitter, M: mirror, LP: long pass fi lter.
k-means cluster analysis are the centers of each cluster that represent an
average spectrum and the cluster membership map. The clusters in the
color-coded membership map can be assigned to anatomical features.
Fiber tracts corresponding to white matter could be identified in the
cerebellum and around a ventricle (Fig. 8.1b). A cistern was resolved
between the left- and the right-brain hemisphere and below the mesen-
cephalon. In a second specimen, brain metastases of malignant mela-
nomas were found near the cistern (Fig. 8.1c). Further details could be
visualized in FTIR images with a spatial resolution of 25 μm which
were recorded from consecutive tissue sections. 8
Mean cluster spectra are shown in Fig. 8.2. Raman spectra of a
protein mixture comprising the all-alpha helical protein serum albu-
min and the all-beta sheet protein concanavalin A, and a phospholipid
are included for comparison. Bands in the Raman spectrum of phos-
phatidylcholin which represents a phospholipid are assigned to the
−1
hydrophilic head group choline (717, 875 cm ), the phosphate group
−1
−1
(1089 cm ), the ester group (1738 cm ), and the hydrophobic unsat-
urated fatty acid moiety (1066, 1130, 1270, 1301, 1442, 1660, 2852,
−1
2886 cm ). The Raman spectra of other brain lipids have previously
9
been reported. Bands in the Raman spectrum of a protein mixture are
−1
assigned to the peptide backbone (940, 1243, 1665 cm ), disulfide
−1
bonds between the amino acid cysteine (508 cm ) the aromatic amino
−1
−1
acids phenylalanine (621, 1004 cm ), tyrosine (643, 828, 853 cm ), tryp-
−1
−1
tophan (760, 1340 cm ), and aliphatic amino acids (1447, 2932 cm ).