
Page 254 - Vibrational Spectroscopic Imaging for Biomedical Applications
P. 254
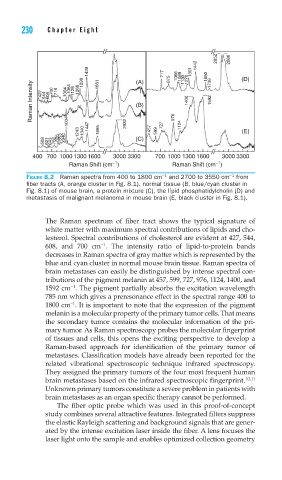
230    Cha pte r  Ei g h t


                                                       2852  2886
                                                  1442
                    1439 1298  1661  (A)  717  875  1066  1089  1130  1270  1301  1660  1738  (D)
     Raman Intensity  427  544  608  700  716  1004  1064  1128  1268  (B)  1400  1592


               1004
                  1243  1340  1447  1665  2932  457  599  727  976  1124  (E)
        508  621  643  760  828  853  940  (C)

     400  700  1000  1300 1600  3000  3300  700  1000  1300  1600  3000  3300
                           –1
                                                       –1
               Raman Shift (cm )           Raman Shift (cm )
                                                           −1
                                        −1
   FIGURE 8.2  Raman spectra from 400 to 1800 cm  and 2700 to 3550 cm  from
   fi ber tracts (A, orange cluster in Fig. 8.1), normal tissue (B, blue/cyan cluster in
   Fig. 8.1) of mouse brain, a protein mixture (C), the lipid phosphatidylcholin (D) and
   metastasis of malignant melanoma in mouse brain (E, black cluster in Fig. 8.1).
        The Raman spectrum of fiber tract shows the typical signature of
        white matter with maximum spectral contributions of lipids and cho-
        lesterol. Spectral contributions of cholesterol are evident at 427, 544,
                        −1
        608, and 700 cm . The intensity ratio of lipid-to-protein bands
        decreases in Raman spectra of gray matter which is represented by the
        blue and cyan cluster in normal mouse brain tissue. Raman spectra of
        brain metastases can easily be distinguished by intense spectral con-
        tributions of the pigment melanin at 457, 599, 727, 976, 1124, 1400, and
               −1
        1592 cm . The pigment partially absorbs the excitation wavelength
        785 nm which gives a preresonance effect in the spectral range 400 to
               −1
        1800 cm . It is important to note that the expression of the pigment
        melanin is a molecular property of the primary tumor cells. That means
        the secondary tumor contains the molecular information of the pri-
        mary tumor. As Raman spectroscopy probes the molecular fingerprint
        of tissues and cells, this opens the exciting perspective to develop a
        Raman-based approach for identification of the primary tumor of
        metastases. Classification models have already been reported for the
        related vibrational spectroscopic technique infrared spectroscopy.
        They assigned the primary tumors of the four most frequent human
        brain metastases based on the infrared spectroscopic fingerprint. 10,11
        Unknown primary tumors constitute a severe problem in patients with
        brain metastases as an organ specific therapy cannot be performed.
            The fiber optic probe which was used in this proof-of-concept
        study combines several attractive features. Integrated filters suppress
        the elastic Rayleigh scattering and background signals that are gener-
        ated by the intense excitation laser inside the fiber. A lens focuses the
        laser light onto the sample and enables optimized collection geometry