
Page 259 - Vibrational Spectroscopic Imaging for Biomedical Applications
P. 259
Raman Micr oscopy for Biomedical Applications 235
1447
1662
1005
701 722 (a)
Raman Intensity 1547 1607 1621
755 1004 1214 1564
(b)
700 900 1100 1300 1500 1700
–1
Raman Shift (cm )
500 μm
(c)
−1
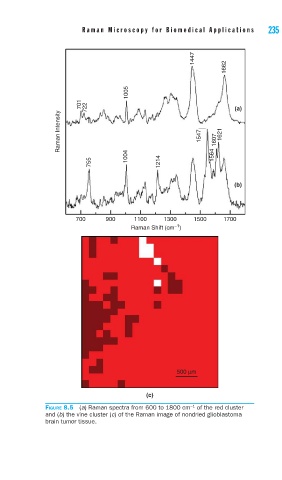
FIGURE 8.5 (a) Raman spectra from 600 to 1800 cm of the red cluster
and (b) the vine cluster (c) of the Raman image of nondried glioblastoma
brain tumor tissue.