Page 264 - Vibrational Spectroscopic Imaging for Biomedical Applications
P. 264

240    Cha pte r  Ei g h t


                                               1440


               Raman Intensity                           (A)

                                                         (B)
                                                         (C)
                                  1062
                                          1300


                   700    900    1100   1300   1500   1700
                                           –1
                                Raman Shift (cm )
                                     (a)


                        (b)     100 μm  100 μm  (c)
                                                −1
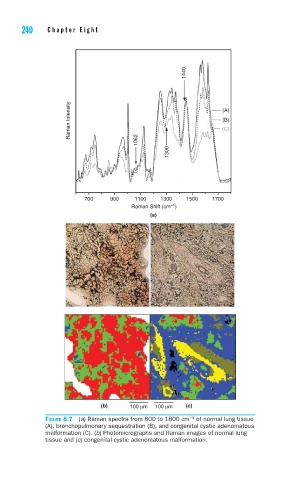
        FIGURE 8.7  (a) Raman spectra from 600 to 1800 cm  of normal lung tissue
        (A), bronchopulmonary sequestration (B), and congenital cystic adenomatous
        malformation (C). (b) Photomicrographs and Raman images of normal lung
        tissue and (c) congenital cystic adenomatous malformation.
   259   260   261   262   263   264   265   266   267   268   269