
Page 268 - Vibrational Spectroscopic Imaging for Biomedical Applications
P. 268
244 Cha pte r Ei g h t
1449
1003 1320 1340 1655
1255 1297
936 1092
786 813 827 852 1030 1061 1127 1207 1375 1577
Raman Intensity 621 643 669 680 727 757 (A)
(B)
(C)
700 900 1100 1300 1500 1700
–1
Raman Shift (cm )
(a)
(b)
10 μm
(c)
−1
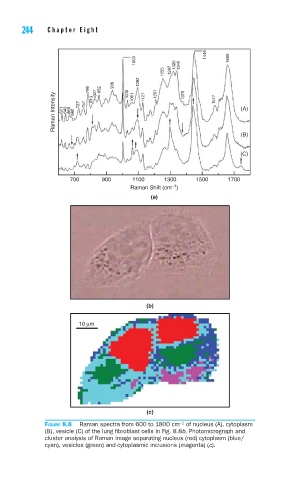
FIGURE 8.8 Raman spectra from 600 to 1800 cm of nucleus (A), cytoplasm
(B), vesicle (C) of the lung fi broblast cells in Fig. 8.8b. Photomicrograph and
cluster analysis of Raman image separating nucleus (red) cytoplasm (blue/
cyan), vesicles (green) and cytoplasmic inclusions (magenta) (c).