Page 330 - Vibrational Spectroscopic Imaging for Biomedical Applications
P. 330

304    Cha pte r  T e n


                    Back to Spectrometer

                                Confocal Pinhole


             Notch Filter


                                           In-focus scattered light
            Pinhole                        Out-of-focus scattered light
                                Pinhole
                                            Defocusing Technique
           Laser Beam          Microscope   Confocal Probe
                                            *
                               Objective Lens Z c
           Focal Plane
                                                             Z 0
                     Sample

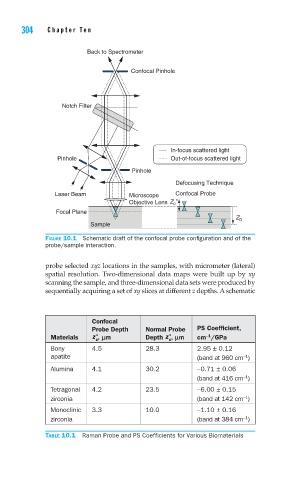
        FIGURE 10.1  Schematic draft of the confocal probe confi guration and of the
        probe/sample interaction.


        probe selected xyz locations in the samples, with micrometer (lateral)
        spatial resolution. Two-dimensional data maps were built up by  xy
        scanning the sample, and three-dimensional data sets were produced by
        sequentially acquiring a set of xy slices at different z depths. A schematic


                     Confocal
                     Probe Depth    Normal Probe   PS Coefficient,
                      *                   *
                                                    -1
          Materials  z , lm         Depth z , lm  cm /GPa
                                          c
                      c
          Bony       4.5            28.3          2.95 ± 0.12
          apatite                                 (band at 960 cm )
                                                               −1
          Alumina    4.1            30.2          −0.71 ± 0.06
                                                               −1
                                                  (band at 416 cm )
          Tetragonal  4.2           23.5          −6.00 ± 0.15
                                                               −1
          zirconia                                (band at 142 cm )
          Monoclinic  3.3           10.0          −1.10 ± 0.16
                                                               −1
          zirconia                                (band at 384 cm )
        TABLE 10.1  Raman Probe and PS Coefficients for Various Biomaterials
   325   326   327   328   329   330   331   332   333   334   335