
Page 332 - Vibrational Spectroscopic Imaging for Biomedical Applications
P. 332
306 Cha pte r T e n
A Protein
Intensity (a.u.) E Amorphous A + E + E 2 Protein Bonds
Apatite
1
1
A + E
2
500 1000 1500 2000 2500 3000
–1
Wavenumber (cm )
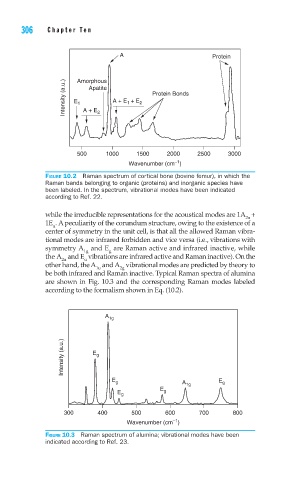
FIGURE 10.2 Raman spectrum of cortical bone (bovine femur), in which the
Raman bands belonging to organic (proteins) and inorganic species have
been labeled. In the spectrum, vibrational modes have been indicated
according to Ref. 22.
while the irreducible representations for the acoustical modes are 1A +
2u
1E . A peculiarity of the corundum structure, owing to the existence of a
u
center of symmetry in the unit cell, is that all the allowed Raman vibra-
tional modes are infrared forbidden and vice versa (i.e., vibrations with
symmetry A and E are Raman active and infrared inactive, while
1g g
the A and E vibrations are infrared active and Raman inactive). On the
2u u
other hand, the A and A vibrational modes are predicted by theory to
1u 2g
be both infrared and Raman inactive. Typical Raman spectra of alumina
are shown in Fig. 10.3 and the corresponding Raman modes labeled
according to the formalism shown in Eq. (10.2).
A 1g
Intensity (a.u.) E g
E g A 1g E g
E
E g g
300 400 500 600 700 800
–1
Wavenumber (cm )
FIGURE 10.3 Raman spectrum of alumina; vibrational modes have been
indicated according to Ref. 23.