
Page 334 - Vibrational Spectroscopic Imaging for Biomedical Applications
P. 334
308 Cha pte r T e n
(a) Monoclinic Polymorph
A g B g
B
A g g B g
A g + B g A g
A B g A g
B g g
(b) Tetragonal Polymorph
E
Intensity (a.u.) B 1g B 1g E g A 1ag E g
g
(c) Mixed Tetragonal/Monoclinic Polymorphs
MT
MT
MT
T
M M
M
T M M MT
M
0 200 400 600 800
–1
Wavenumber (cm )
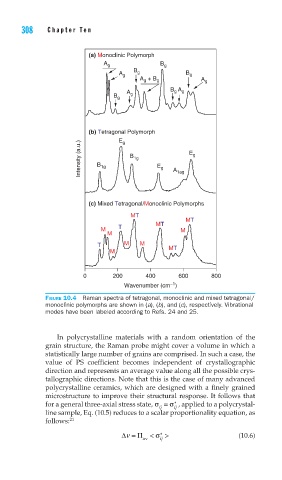
FIGURE 10.4 Raman spectra of tetragonal, monoclinic and mixed tetragonal/
monoclinic polymorphs are shown in (a), (b), and (c), respectively. Vibrational
modes have been labeled according to Refs. 24 and 25.
In polycrystalline materials with a random orientation of the
grain structure, the Raman probe might cover a volume in which a
statistically large number of grains are comprised. In such a case, the
value of PS coefficient becomes independent of crystallographic
direction and represents an average value along all the possible crys-
tallographic directions. Note that this is the case of many advanced
polycrystalline ceramics, which are designed with a finely grained
microstructure to improve their structural response. It follows that
for a general three-axial stress state, σ = σ , applied to a polycrystal-
∗
ij ij
line sample, Eq. (10.5) reduces to a scalar proportionality equation, as
follows: 21
Δν = Π < σ ∗ > (10.6)
av ij