
Page 337 - Vibrational Spectroscopic Imaging for Biomedical Applications
P. 337
Raman Imaging of Str ess Patterns in Biomaterials 311
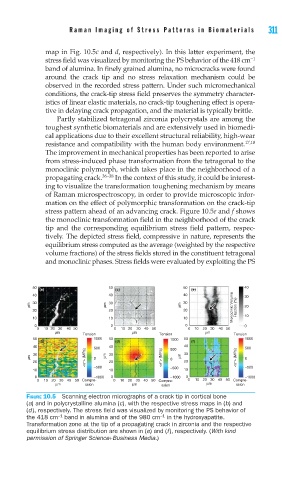
map in Fig. 10.5c and d, respectively). In this latter experiment, the
stress field was visualized by monitoring the PS behavior of the 418 cm −1
band of alumina. In finely grained alumina, no microcracks were found
around the crack tip and no stress relaxation mechanism could be
observed in the recorded stress pattern. Under such micromechanical
conditions, the crack-tip stress field preserves the symmetry character-
istics of linear elastic materials, no crack-tip toughening effect is opera-
tive in delaying crack propagation, and the material is typically brittle.
Partly stabilized tetragonal zirconia polycrystals are among the
toughest synthetic biomaterials and are extensively used in biomedi-
cal applications due to their excellent structural reliability, high-wear
resistance and compatibility with the human body environment. 17,18
The improvement in mechanical properties has been reported to arise
from stress-induced phase transformation from the tetragonal to the
monoclinic polymorph, which takes place in the neighborhood of a
propagating crack. 36–38 In the context of this study, it could be interest-
ing to visualize the transformation toughening mechanism by means
of Raman microspectroscopy, in order to provide microscopic infor-
mation on the effect of polymorphic transformation on the crack-tip
stress pattern ahead of an advancing crack. Figure 10.5e and f shows
the monoclinic transformation field in the neighborhood of the crack
tip and the corresponding equilibrium stress field pattern, respec-
tively. The depicted stress field, compressive in nature, represents the
equilibrium stress computed as the average (weighted by the respective
volume fractions) of the stress fields stored in the constituent tetragonal
and monoclinic phases. Stress fields were evaluated by exploiting the PS
50 50 50 40
(a) (c) (e)
40 40 40 30
μm 30 μm 30 μm 30 Monoclinic Volume Fraction (%) 20
20 20 20
10 10 10 10
0 0 0 0
0 10 20 30 40 50 0 10 20 30 40 50 0 10 20 30 40 50
μm μm μm
Tension Tension Tension
50 1000 50 1000 50 1000
(b) (d) (f)
40 500 40 500 40 500
μm 30 <σ*> (MPa) 0 μm 30 <σ*> (MPa) 0 μm 30 <σ*> (MPa) 0
20 20 20
10 –500 10 –500 10 –500
0 –1000 0 –1000 0 –1000
0 10 20 30 40 50 Compre- 0 10 20 30 40 50 Compre- 0 10 20 30 40 50 Compre-
μm ssion μm ssion μm ssion
FIGURE 10.5 Scanning electron micrographs of a crack tip in cortical bone
(a) and in polycrystalline alumina (c), with the respective stress maps in (b) and
(d), respectively. The stress fi eld was visualized by monitoring the PS behavior of
−1
−1
the 418 cm band in alumina and of the 980 cm in the hydroxyapatite.
Transformation zone at the tip of a propagating crack in zirconia and the respective
equilibrium stress distribution are shown in (e) and (f), respectively. (With kind
permission of Springer Science+Business Media.)