
Page 339 - Vibrational Spectroscopic Imaging for Biomedical Applications
P. 339
Raman Imaging of Str ess Patterns in Biomaterials 313
scientists and technologists with new insight into contact mechanics,
being capable to reveal microscopic patterns of residual stress stored on
the bearing surfaces. In other words, the kinetics of surface sliding
within the joint (i.e., including microdisplacements) remains stored
onto its bearing surfaces and Raman maps of residual stress reveal it
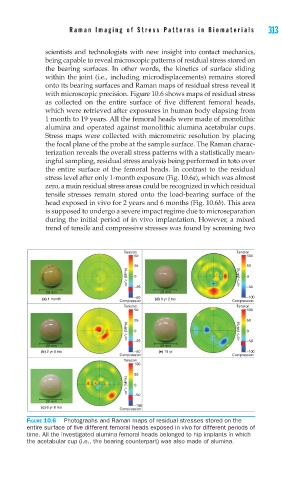
with microscopic precision. Figure 10.6 shows maps of residual stress
as collected on the entire surface of five different femoral heads,
which were retrieved after exposures in human body elapsing from
1 month to 19 years. All the femoral heads were made of monolithic
alumina and operated against monolithic alumina acetabular cups.
Stress maps were collected with micrometric resolution by placing
the focal plane of the probe at the sample surface. The Raman charac-
terization reveals the overall stress patterns with a statistically mean-
ingful sampling, residual stress analysis being performed in toto over
the entire surface of the femoral heads. In contrast to the residual
stress level after only 1-month exposure (Fig. 10.6a), which was almost
zero, a main residual stress areas could be recognized in which residual
tensile stresses remain stored onto the load-bearing surface of the
head exposed in vivo for 2 years and 6 months (Fig. 10.6b). This area
is supposed to undergo a severe impact regime due to microseparation
during the initial period of in vivo implantation. However, a mixed
trend of tensile and compressive stresses was found by screening two
Tension Tension
50 100
25 50
<σ*> (MPa) 0 <σ*> (MPa) 0
28 mm –25 28 mm –50
(a) 1 month –50 (d) 8 yr 2 mo –100
Compression Compression
Tension Tension
50 100
25 50
<σ*> (MPa) 0 <σ*> (MPa) 0
28 mm –25 28 mm –50
(b) 2 yr 6 mo –50 (e) 19 yr –100
Compression Compression
Tension
100
50
<σ*> (MPa) 0
28 mm –50
–100
(c) 6 yr 8 mo Compression
FIGURE 10.6 Photographs and Raman maps of residual stresses stored on the
entire surface of fi ve different femoral heads exposed in vivo for different periods of
time. All the investigated alumina femoral heads belonged to hip implants in which
the acetabular cup (i.e., the bearing counterpart) was also made of alumina.