
Page 110 - Materials Chemistry, Second Edition
P. 110
CAT3525_C04.qxd 1/27/2005 11:12 AM Page 81
Characterization of Solid Waste 81
TABLE 4.17
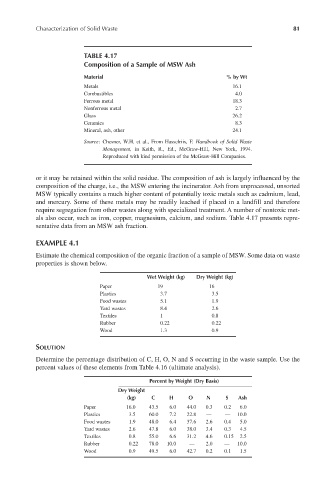
Composition of a Sample of MSW Ash
Material % by Wt
Metals 16.1
Combustibles 4.0
Ferrous metal 18.3
Nonferrous metal 2.7
Glass 26.2
Ceramics 8.3
Mineral, ash, other 24.1
Source: Chesner, W.H. et al., From Hasselriis, F. Handbook of Solid Waste
Management, in Keith, R., Ed., McGraw-Hill, New York, 1994.
Reproduced with kind permission of the McGraw-Hill Companies.
or it may be retained within the solid residue. The composition of ash is largely influenced by the
composition of the charge, i.e., the MSW entering the incinerator. Ash from unprocessed, unsorted
MSW typically contains a much higher content of potentially toxic metals such as cadmium, lead,
and mercury. Some of these metals may be readily leached if placed in a landfill and therefore
require segregation from other wastes along with specialized treatment. A number of nontoxic met-
als also occur, such as iron, copper, magnesium, calcium, and sodium. Table 4.17 presents repre-
sentative data from an MSW ash fraction.
EXAMPLE 4.1
Estimate the chemical composition of the organic fraction of a sample of MSW. Some data on waste
properties is shown below.
Wet Weight (kg) Dry Weight (kg)
Paper 19 16
Plastics 3.7 3.5
Food wastes 5.1 1.9
Yard wastes 8.4 2.6
Textiles 1 0.8
Rubber 0.22 0.22
Wood 1.3 0.9
SOLUTION
Determine the percentage distribution of C, H, O, N and S occurring in the waste sample. Use the
percent values of these elements from Table 4.16 (ultimate analysis).
Percent by Weight (Dry Basis)
Dry Weight
(kg) C H O N S Ash
Paper 16.0 43.5 6.0 44.0 0.3 0.2 6.0
Plastics 3.5 60.0 7.2 22.8 — — 10.0
Food wastes 1.9 48.0 6.4 37.6 2.6 0.4 5.0
Yard wastes 2.6 47.8 6.0 38.0 3.4 0.3 4.5
Textiles 0.8 55.0 6.6 31.2 4.6 0.15 2.5
Rubber 0.22 78.0 10.0 — 2.0 — 10.0
Wood 0.9 49.5 6.0 42.7 0.2 0.1 1.5