
Page 111 - Materials Chemistry, Second Edition
P. 111
CAT3525_C04.qxd 1/27/2005 11:12 AM Page 82
82 Waste Management Practices: Municipal, Hazardous, and Industrial
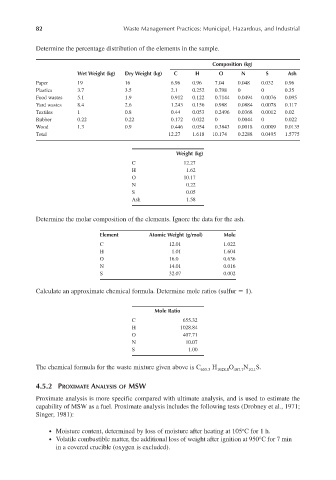
Determine the percentage distribution of the elements in the sample.
Composition (kg)
Wet Weight (kg) Dry Weight (kg) C H O N S Ash
Paper 19 16 6.96 0.96 7.04 0.048 0.032 0.96
Plastics 3.7 3.5 2.1 0.252 0.798 0 0 0.35
Food wastes 5.1 1.9 0.912 0.122 0.7144 0.0494 0.0076 0.095
Yard wastes 8.4 2.6 1.243 0.156 0.988 0.0884 0.0078 0.117
Textiles 1 0.8 0.44 0.053 0.2496 0.0368 0.0012 0.02
Rubber 0.22 0.22 0.172 0.022 0 0.0044 0 0.022
Wood 1.3 0.9 0.446 0.054 0.3843 0.0018 0.0009 0.0135
Total 12.27 1.618 10.174 0.2288 0.0495 1.5775
Weight (kg)
C 12.27
H 1.62
O 10.17
N 0.22
S 0.05
Ash 1.58
Determine the molar composition of the elements. Ignore the data for the ash.
Element Atomic Weight (g/mol) Mole
C 12.01 1.022
H 1.01 1.604
O 16.0 0.636
N 14.01 0.016
S 32.07 0.002
Calculate an approximate chemical formula. Determine mole ratios (sulfur 1).
Mole Ratio
C 655.32
H 1028.84
O 407.71
N 10.07
S 1.00
The chemical formula for the waste mixture given above is C 655.3 H 1028.8 O 407.7 N 10.1 S.
4.5.2 PROXIMATE ANALYSIS OF MSW
Proximate analysis is more specific compared with ultimate analysis, and is used to estimate the
capability of MSW as a fuel. Proximate analysis includes the following tests (Drobney et al., 1971;
Singer, 1981):
o
● Moisture content, determined by loss of moisture after heating at 105 C for 1 h.
● Volatile combustible matter, the additional loss of weight after ignition at 950°C for 7 min
in a covered crucible (oxygen is excluded).