Page 43 - Materials Chemistry, Second Edition
P. 43

CAT3525_C01.qxd  1/27/2005  10:54 AM  Page 14
                       14                        Waste Management Practices: Municipal, Hazardous, and Industrial


                       TABLE 1.3
                       Materials Generated (thousands of tons) in MSW, 1960 to 1999

                       Material                   1960         1970       1980        1990       1999
                       Wastes from Specific Products
                       Paper and paperboard       29,990      44,310      55,160      72,730    87,470
                       Glass                       6,720      12,740      15,130      13,100    12,560
                       Metals
                        Ferrous                   10,300      12,360      12,620      12,640    13,320
                        Aluminum                    340         800        1,730      2,810      3,130
                        Other nonferrous            180         670        1,160      1,100      1,390
                        Total Metals              10,820      13,830      15,510      16,550    17,840
                       Plastics                     390        2,900       6,830      17,130    24,170
                       Rubber and leather          1,840      12,970       4,200      5,790      6,220
                       Textiles                    1,760       2,040       2,530      5,810      9,060
                       Wood                        3,030       3,720       7,010      12,210    12,250
                       Other                         70         770        2,520      3,190      4,010
                       Total                      54,620      83,280     108,890     146,510    173,580
                       Other Wastes
                       Food wastes                12,200      12,800      13,000      20,800    25,161
                       Yard wastes                20,000      23,200      27,500      35,000    27,730
                       Miscellaneous inorganic wastes  1,300   1,780       2,250      2,900      3,380
                       Total other Wastes         33,500      37,780      42,750      58,700    56,270
                       Total MSW generated        88,120      121,060    151,640     205,210    229,850
                       Source: U.S. EPA, 2001.


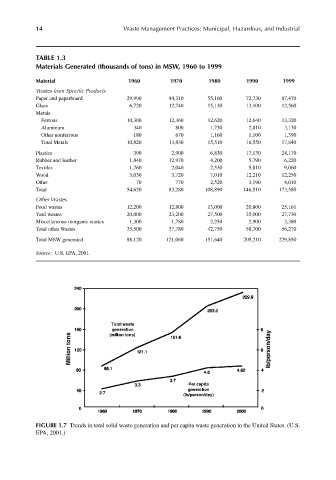
                       FIGURE 1.7 Trends in total solid waste generation and per capita waste generation in the United States. (U.S.
                       EPA, 2001.)
   38   39   40   41   42   43   44   45   46   47   48