
Page 45 - Materials Chemistry, Second Edition
P. 45
CAT3525_C01.qxd 1/27/2005 10:54 AM Page 16
16 Waste Management Practices: Municipal, Hazardous, and Industrial
of diverted materials grows, but often without a corresponding demand. Consequently, collected
materials may have to be stockpiled or sometimes dumped until new markets are created through
incentives, legislation, or the market system. Such pitfalls are addressed in later chapters.
1.4.1 SOURCE REDUCTION
Source reduction or waste prevention includes the design, manufacture, purchase, or use of materi-
als such as products and packaging, in a manner that reduces their amount or toxicity before they
enter the waste management system. In other words, by not producing the waste, there is no longer
a concern over storage, collection, disposal costs, and liability. Examples of source reduction activ-
ities include (U.S. EPA, 2001):
● Designing products or packaging to reduce the quantity or the toxicity of the materials
used, or to make the materials easy to reuse.
● Reusing existing products or packaging, for example, refillable bottles, reusable pallets,
and reconditioned barrels and drums.
● Lengthening the lives of products such as tires to postpone disposal.
● Using packaging that reduces the amount of damage or spoilage to the product.
● Managing nonproduct organic wastes (e.g., food scraps and yard waste) through on-site
composting or other alternatives to disposal (e.g., leaving grass clippings on the lawn).
The U.S. EPA has only recently been estimating source reduction based on national production
and disposal data. In 1999, the U.S. public and businesses prevented more than 50 million tons of
MSW from entering the waste stream. Containers and packaging represent approximately 24% of the
materials source reduced in 1999, in addition to nondurable goods (e.g., newspapers) at 18%, durable
goods (e.g., appliances, furniture, tires) at 11%, and other materials (e.g., yard and food wastes).
Almost half (47%) of the total waste prevented since 1992 includes organic waste materials such as
yard and food wastes. This is the result of many locally enacted bans on the disposal of yard waste
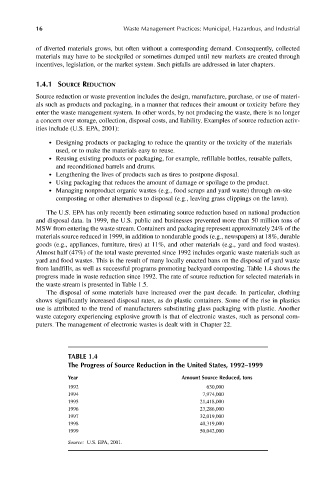
from landfills, as well as successful programs promoting backyard composting. Table 1.4 shows the
progress made in waste reduction since 1992. The rate of source reduction for selected materials in
the waste stream is presented in Table 1.5.
The disposal of some materials have increased over the past decade. In particular, clothing
shows significantly increased disposal rates, as do plastic containers. Some of the rise in plastics
use is attributed to the trend of manufacturers substituting glass packaging with plastic. Another
waste category experiencing explosive growth is that of electronic wastes, such as personal com-
puters. The management of electronic wastes is dealt with in Chapter 22.
TABLE 1.4
The Progress of Source Reduction in the United States, 1992–1999
Year Amount Source Reduced, tons
1992 630,000
1994 7,974,000
1995 21,418,000
1996 23,286,000
1997 32,019,000
1998 40,319,000
1999 50,042,000
Source: U.S. EPA, 2001.