
Page 46 - Materials Chemistry, Second Edition
P. 46
CAT3525_C01.qxd 1/27/2005 10:54 AM Page 17
Introduction 17
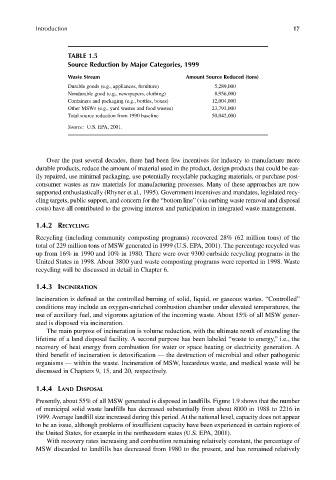
TABLE 1.5
Source Reduction by Major Categories, 1999
Waste Stream Amount Source Reduced (tons)
Durable goods (e.g., appliances, furniture) 5,289,000
Nondurable good (e.g., newspapers, clothing) 8,956,000
Containers and packaging (e.g., bottles, boxes) 12,004,000
Other MSWs (e.g., yard wastes and food wastes) 23,793,000
Total source reduction from 1990 baseline 50,042,000
Source: U.S. EPA, 2001.
Over the past several decades, there had been few incentives for industry to manufacture more
durable products, reduce the amount of material used in the product, design products that could be eas-
ily repaired, use minimal packaging, use potentially recyclable packaging materials, or purchase post-
consumer wastes as raw materials for manufacturing processes. Many of these approaches are now
supported enthusiastically (Rhyner et al., 1995). Government incentives and mandates, legislated recy-
cling targets, public support, and concern for the “bottom line” (via curbing waste removal and disposal
costs) have all contributed to the growing interest and participation in integrated waste management.
1.4.2 RECYCLING
Recycling (including community composting programs) recovered 28% (62 million tons) of the
total of 229 million tons of MSW generated in 1999 (U.S. EPA, 2001). The percentage recycled was
up from 16% in 1990 and 10% in 1980. There were over 9300 curbside recycling programs in the
United States in 1998. About 3800 yard waste composting programs were reported in 1998. Waste
recycling will be discussed in detail in Chapter 6.
1.4.3 INCINERATION
Incineration is defined as the controlled burning of solid, liquid, or gaseous wastes. “Controlled”
conditions may include an oxygen-enriched combustion chamber under elevated temperatures, the
use of auxiliary fuel, and vigorous agitation of the incoming waste. About 15% of all MSW gener-
ated is disposed via incineration.
The main purpose of incineration is volume reduction, with the ultimate result of extending the
lifetime of a land disposal facility. A second purpose has been labeled “waste to energy,” i.e., the
recovery of heat energy from combustion for water or space heating or electricity generation. A
third benefit of incineration is detoxification — the destruction of microbial and other pathogenic
organisms — within the waste. Incineration of MSW, hazardous waste, and medical waste will be
discussed in Chapters 9, 15, and 20, respectively.
1.4.4 LAND DISPOSAL
Presently, about 55% of all MSW generated is disposed in landfills. Figure 1.9 shows that the number
of municipal solid waste landfills has decreased substantially from about 8000 in 1988 to 2216 in
1999. Average landfill size increased during this period. At the national level, capacity does not appear
to be an issue, although problems of insufficient capacity have been experienced in certain regions of
the United States, for example in the northeastern states (U.S. EPA, 2001).
With recovery rates increasing and combustion remaining relatively constant, the percentage of
MSW discarded to landfills has decreased from 1980 to the present, and has remained relatively