
Page 51 - Water Engineering Hydraulics, Distribution and Treatment
P. 51
29
2.5 Loss by Evaporation, Seepage, and Silting
length yearly. In rough approximation, the spillway level is
raised by a foot or two (0.3048 m or 0.6096 m) in the eastern
revetment of stream banks.
United States.
In the design of impounding reservoirs for silt-bearing
streams, suitable allowance must be made for loss of capacity
by silting. Rates of deposition are especially high in impound-
2.5.2 Seepage
ments on flashy streams draining easily eroded catchment
areas. The proportion of sediment retained is called its trap
If the valley enclosing a reservoir is underlain by porous
efficiency. A simple calculation will show that 2000 mg/L
strata, water may be lost by seepage. Subsurface exploration
of suspended solids equals 8.3 tons/MG (1.989 tonnes/ML)
alone can foretell how much. Seepage is not necessarily con-
and that an acre-ft of silt weighs almost 1,500 tons (1360.8
fined to the dam site. It may occur wherever the sides and
3
3
tonnes) if its unit weight is 70 lb/ft (1211.4 kg/m ). In
bottom of the reservoir are sufficiently permeable to permit
some parts of the United States the volume of silt V in
s
water to escape through the surrounding hills. through construction of check dams or debris barriers; and
3
3
acre-ft (1 acre-ft = 0.32585 MG = 43,560 ft = 1,233.5m )
deposited annually can be approximated by the equation
2.5.3 Silting n
V = cA (US customary units) (2.7)
s
Soil erosion on the watershed causes reservoir silting. 2
where A is the size of the drainage area in mi (note:
Both are undesirable. Erosion destroys arable lands. Silting 2 2
1mi = 2.59 km ), and c and n are coefficients with a value
destroys useful storage (see Fig. 2.9). How bad conditions
of n = 0.77 for the US southwestern streams and values of
are in a given catchment area depends principally on soil and
c varying from 0.43 through 1.7 to 4.8 for low, average,
rock types, ground-surface slopes, vegetal cover, methods of
and high deposition, respectively, the corresponding values
cultivation, and storm-rainfall intensities.
for southeastern streams being c = 0.44 only and n = 1.0.
Silt accumulations cannot be removed economically
Understandably, the magnitudes of c and n, here reported,
from reservoirs by any means so far devised. Dredging is
apply only to the regions for which they were developed.
expensive, and attempts to flush out deposited silt by opening
The volume of silt deposited annually can also be
scour valves in dams are fruitless. Scour only produces gul-
approximated by the following equation using metric units:
lies in the silt. In favorable circumstances, however, much of
the heaviest load of suspended silt can be steered through the 6 n
V = 1,233.5c[A/(2.59 × 10 )] (SI units) (2.7a)
s
reservoir by opening large sluices installed for this purpose.
Flood flows are thereby selected for storage in accordance where
with their quality as well as their volume.
Reduction of soil erosion is generally a long-range V = volume of silt deposited annually, m 3
undertaking. Involved are proper farming methods, such as s 2
A = the size of the drainage area, m
contour plowing; terracing of hillsides; reforestation; culti-
vation of permanent pastures; prevention of gully formation c = a coefficient with a value varying from 0.43 to 1.7 to
4.8 for low, average, and high deposition, respectively
n = a coefficient to be determined specifically for a tar-
get drainage area 0.77 for southwestern steams in the
United States
A plot of trap efficiency against the proportion of the
mean annual flow stored in a reservoir traces curves quite sim-
ilar to curves for the expected performance of settling basins
of varying effectiveness. Close to 100% of the sediment trans-
ported by influent streams may be retained in reservoirs stor-
ing a full year’s tributary flow. Trap efficiency drops to a point
between 65% and 85% when the storage ratio is reduced to
0.5 (half a year’s inflow) and to 30–60% when the storage
ratio is lowered to 0.1 (5 weeks’ inflow). Silting is often
fast when reservoirs are first placed in service and may be
expected to drop off and reach a steady state as delta building
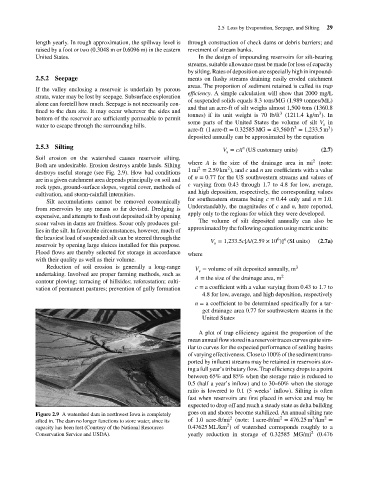
Figure 2.9 A watershed dam in northwest Iowa is completely goes on and shores become stabilized. An annual silting rate
3
2
2
2
silted in. The dam no longer functions to store water, since its of 1.0 acre-ft/mi (note: 1 acre-ft/mi = 476.25 m /km =
2
capacity has been lost (Courtesy of the National Resources 0.47625 ML/km ) of watershed corresponds roughly to a
2
Conservation Service and USDA). yearly reduction in storage of 0.32585 MG/mi (0.476