Page 50 - Water Engineering Hydraulics, Distribution and Treatment
P. 50

28
                                                  Water Sources: Surface Water
                                         Chapter 2
                                      EXAMPLE 2.2 DESIGN OF STORAGE REQUIREMENT FOR VARIOUS FREQUENCIES
                                      Examination of the 25-year record of runoff from an eastern stream shows that the storage amounts listed in Table 2.3 are needed
                                                                                 2
                                      in successive years to maintain a draft of 750,000 gpd/mi (1,096,000 L/d/km ). Estimate the design storage requirement that is
                                      probably reached or exceeded but once in 20, 50, and 100 years.
                                       Table 2.3
                                               Storage requirements (Example 2.2)
                                                                                                 7
                                                                                           6
                                                             1
                                                                         3
                                                                               4
                                                                  2
                                       Order of year
                                                                       104
                                                                                                                       37
                                                                  39
                                                                                                                  29
                                       Calculated storage (MG)
                                                            47
                                                                                                                                  78
                                                                                                 74
                                                                                                                             82
                                                                             110
                                                                                                            22
                                                                  15
                                                                                                                             25
                                                                                                 20
                                                                                                      21
                                                            14
                                                                                          19
                                       Order of year
                                                                                                                  23
                                                                                                                       24
                                                                        16
                                                                              17
                                                                                     18
                                                                              51
                                                                                           8
                                                                                                                             88
                                       Calculated storage (MG)
                                                                                                      65
                                                                                     61
                                                                                                                  20
                                                            72
                                                                  10
                                                                                                            73
                                                                       117
                                                                                                                       53
                                       Conversion factors: 1 MG = 1,000,000 gal = 3.785 ML = 3,785,000 L. 115 5  35  2 102  81 8  124 9  10  11  12  13
                                      Solution:
                                          1. The 25 calculated storage values arrayed in order of magnitude are plotted on arithmetic-probability paper in Fig. 2.8 at
                                            100 k ∕(n + 1) where k = 1, 2, 3, … 25 and n = 25; 100 × 1∕26 = 3.8%, 100 × 2∕26 = 7.7%, 100 × 3∕26 = 11.5%,andso
                                                             i
                                                i
                                            forth. A straight line of best fit is identified in this instance, but not necessarily others, the arithmetic mean storage being    =
                                                                                                                       2
                                            ΣX ∕n = (47 + 39 + 104 + ⋯ + 88)∕25 = 67 MG (254 ML) and the standard deviation    = [Σ(X −   ) ∕(n − 1)] 0.5  where
                                                                                                                   i
                                              i
                                            X = 47, 39, … 88,    = 67 MG and n = 25. Then    = 33 MG (125 ML). The straight line of best fit is plotted in Fig. 2.8 using
                                             i
                                            the data points (3.8% and 8 MG), (7.7% and 10 MG), (11.5% and 20 MG), and so forth. The storage data are chosen from
                                            Table 2.3 starting from the lowest 8 MG in the 19th year.
                                                                99.9                                     0.1
                                                                                  146 MG once in 100 years  1 5
                                                                                 137 MG once in 50 years
                                                                 99
                                                             Percent of years in which required storage was equal to or less than stated magnitude  90  10 Percent of years in which required storage was equal to or greater than stated magnitude
                                                                              123 MG once in 20 years
                                                                 95
                                                                                                         20
                                                                 80
                                                                 70
                                                                                                         30
                                                                 60
                                                                                                         40
                                                                                                         50
                                                                 50
                                                                 40
                                                                                                         60
                                                                                                         70
                                                                 30
                                                                                                         80
                                                                 20
                                                                 10
                                                                                                         95
                                                                  1 5            Straight line of best fit  90
                                                                                                         99
                                                                   0   20   40  60   80  100  120  140  160
                                                                                 Storage (MG)
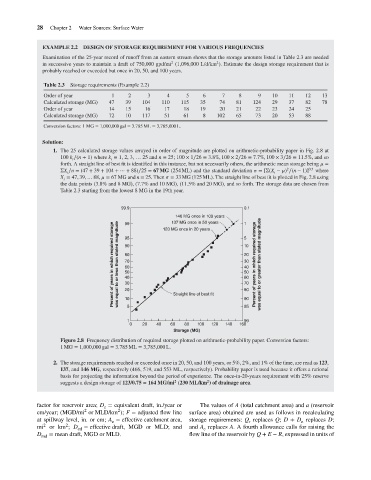
                                            Figure 2.8 Frequency distribution of required storage plotted on arithmetic-probability paper. Conversion factors:
                                            1MG = 1,000,000 gal = 3.785 ML = 3,785,000 L.
                                          2. The storage requirements reached or exceeded once in 20, 50, and 100 years, or 5%, 2%, and 1% of the time, are read as 123,
                                            137,and 146 MG, respectively (466, 519, and 553 ML, respectively). Probability paper is used because it offers a rational
                                            basis for projecting the information beyond the period of experience. The once-in-20-years requirement with 25% reserve
                                                                                            2
                                                                                  2
                                            suggests a design storage of 123/0.75 = 164 MG/mi (230 ML/km ) of drainage area.
                                    factor for reservoir area; D = equivalent draft, in./year or  The values of A (total catchment area) and a (reservoir
                                                          e
                                                               2
                                                    2
                                    cm/year; (MGD/mi or MLD/km ); F = adjusted flow line  surface area) obtained are used as follows in recalculating
                                    at spillway level, in. or cm; A = effective catchment area,  storage requirements: Q replaces Q; D + D replaces D;
                                                                                                                            e
                                                                                                          r
                                                             e
                                              2
                                    mi 2  or km ; D ed  = effective draft, MGD or MLD; and  and A replaces A. A fourth allowance calls for raising the
                                                                                           e
                                    D md  = mean draft, MGD or MLD.                    flow line of the reservoir by Q + E − R, expressed in units of
   45   46   47   48   49   50   51   52   53   54   55