
Page 131 - Water Loss Control
P. 131
Identifying Economic Interventions against W ater Losses 113
• The cost of water production is estimated.
• The marginal cost is assessed as the sum of the discounted cost plus the
maintenance cost divided by the yield plus the production cost.
• Environmental and social costs associated with the resource development can
be assessed and added to the cost of the option.
Leakage activity schemes, developed using the methodologies described earlier,
would be implemented if these were cheaper than this marginal cost. As the marginal
cost of the new scheme will be significantly higher than the production cost from exist-
ing sources, as it includes the discounted cost of the construction of the works, then it
will be economic to carry out further leakage control measures consisting probably of
more pressure control, a higher level of active leakage control, and possibly more reha-
bilitation and sectorization. Schemes should be implemented until the necessary level
of headroom is attained. This level of leakage could be referred to as the constrained ELL.
The marginal cost of leakage management at this new level of leakage could be referred
to as the marginal value of water. The marginal cost of carrying out additional activity in
any area of leakage or demand management, or resource development will be equal to
or greater than this value.
9.5.2 External Drivers
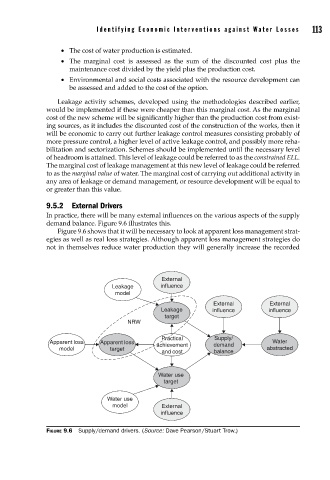
In practice, there will be many external influences on the various aspects of the supply
demand balance. Figure 9.6 illustrates this.
Figure 9.6 shows that it will be necessary to look at apparent loss management strat-
egies as well as real loss strategies. Although apparent loss management strategies do
not in themselves reduce water production they will generally increase the recorded
External
Leakage influence
model
External External
Leakage influence influence
target
NRW
Practical Supply/
Apparent loss Apparent loss achievement demand Water
model target abstracted
and cost balance
Water use
target
Water use
model External
influence
FIGURE 9.6 Supply/demand drivers. (Source: Dave Pearson/Stuart Trow.)