
Page 127 - Water Loss Control
P. 127
Identifying Economic Interventions against W ater Losses 109
• Burst frequency rates will reduce, due to reduced stress on the pipe network,
the so called N2 relationship. 12
Bursts and leaks can be caused by surges on the network. These surges can be
caused by defective operator or customer equipment or the lack of surge suppression
equipment on pumped systems. Short-period logging should be used to investigate
whether a system is experiencing surges before any pressure reduction is investigated.
In the case of pressure reduction, the investment costs will include the one-off cost
of construction of the chambers, the cost of purchasing the pressure reducing valves
(PRVs) and their replacement as well as ongoing maintenance costs. As pressure man-
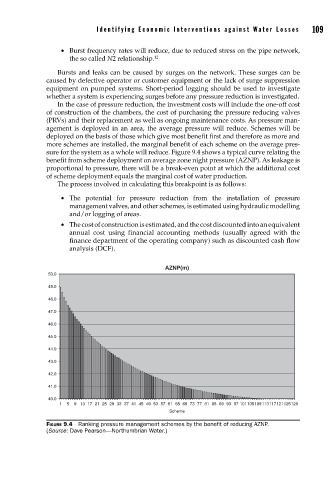
agement is deployed in an area, the average pressure will reduce. Schemes will be
deployed on the basis of those which give most benefit first and therefore as more and
more schemes are installed, the marginal benefit of each scheme on the average pres-
sure for the system as a whole will reduce. Figure 9.4 shows a typical curve relating the
benefit from scheme deployment on average zone night pressure (AZNP). As leakage is
proportional to pressure, there will be a break-even point at which the additional cost
of scheme deployment equals the marginal cost of water production.
The process involved in calculating this breakpoint is as follows:
• The potential for pressure reduction from the installation of pressure
management valves, and other schemes, is estimated using hydraulic modelling
and/or logging of areas.
• The cost of construction is estimated, and the cost discounted into an equivalent
annual cost using financial accounting methods (usually agreed with the
finance department of the operating company) such as discounted cash flow
analysis (DCF).
AZNP(m)
50.0
49.0
48.0
47.0
46.0
45.0
44.0
43.0
42.0
41.0
40.0
1 5 9 13 17 21 25 29 33 37 41 45 49 53 57 61 65 69 73 77 81 85 89 93 97 101105109113117121125129
Scheme
FIGURE 9.4 Ranking pressure management schemes by the benefi t of reducing AZNP.
(Source: Dave Pearson—Northumbrian Water.)