
Page 128 - Water Loss Control
P. 128
110 Cha pte r Ni ne
• The cost of the valve and its replacement (as recommended by the vendor) is
discounted in a similar way.
• The annual cost of maintenance of the PRV (as recommended by the vendor) is
estimated.
• The benefit in terms of leakage reduction is estimated using a component loss
model or similar approach.
• The reduction in operating costs due to the lower burst frequency is assessed in
terms of
• Reduced repair bill
• Reduced customer contact costs for reported leaks
• Reduced visit/inspection costs for reported leaks
• Lower active leakage control costs for unreported leaks
• The marginal cost/benefit is calculated as the net cost divided by the leakage
saving
All the schemes with a cost/benefit lower than the cost of water would be deployed.
This will establish the economic level of pressure reduction and the associated leakage
level. Examples of this approach have been published recently. 13
There will also be less tangible benefits such as
• Reduced risk of discoloured water events
• Reduced interruptions of supply
These benefits will lead to improved levels of service and customer satisfaction and
a reduction in the risk of any regulatory action. A notional monetary value can be placed
on these less tangible benefits in order to allow for these in the calculation.
9.4.2 Network Rehabilitation
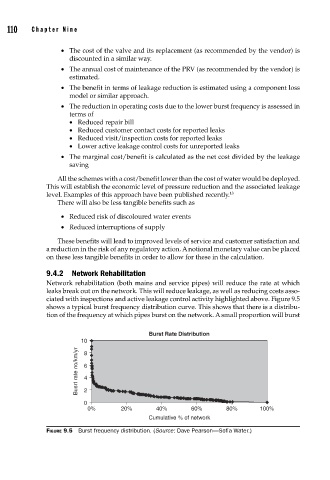
Network rehabilitation (both mains and service pipes) will reduce the rate at which
leaks break out on the network. This will reduce leakage, as well as reducing costs asso-
ciated with inspections and active leakage control activity highlighted above. Figure 9.5
shows a typical burst frequency distribution curve. This shows that there is a distribu-
tion of the frequency at which pipes burst on the network. A small proportion will burst
Burst Rate Distribution
10 8
Busrt rate no/km/yr 6 4
0 2
0% 20% 40% 60% 80% 100%
Cumulative % of network
FIGURE 9.5 Burst frequency distribution. (Source: Dave Pearson—Sofi a Water.)