
Page 123 - Water Loss Control
P. 123
Identifying Economic Interventions against W ater Losses 105
and would therefore be considered in the evaluation of the long-run ELL. There are other
activities that can impact on leakage such as sectorization, customer meter reading policy,
customer side repair policy, extent of customer metering, and so on.
9.3 Short-Run ELL
9.3.1 Active Leakage Control
The purpose of active leakage control (ALC) is to find leaks that do not surface or oth-
erwise come to the attention of the operating company through customer contact, for
example, poor supply, loss of water, and so on. These leaks are often referred to as
reported leaks. The process of active leakage control involves teams of leakage detection
staff sweeping an area to find leaks generally using sounding techniques or similar.
This may be in response to an increase in a nightline if the area is sectorized, an increase
in the output from a treatment works or service reservoir/tank or simply as a result of
a regular sounding programme at an agreed interval.
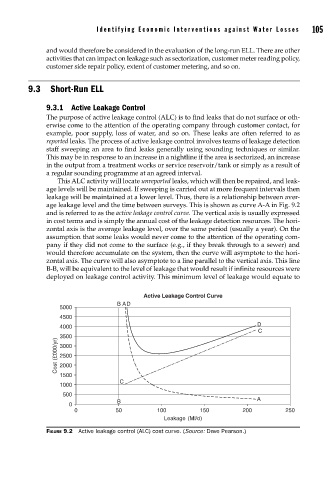
This ALC activity will locate unreported leaks, which will then be repaired, and leak-
age levels will be maintained. If sweeping is carried out at more frequent intervals then
leakage will be maintained at a lower level. Thus, there is a relationship between aver-
age leakage level and the time between surveys. This is shown as curve A-A in Fig. 9.2
and is referred to as the active leakage control curve. The vertical axis is usually expressed
in cost terms and is simply the annual cost of the leakage detection resources. The hori-
zontal axis is the average leakage level, over the same period (usually a year). On the
assumption that some leaks would never come to the attention of the operating com-
pany if they did not come to the surface (e.g., if they break through to a sewer) and
would therefore accumulate on the system, then the curve will asymptote to the hori-
zontal axis. The curve will also asymptote to a line parallel to the vertical axis. This line
B-B, will be equivalent to the level of leakage that would result if infinite resources were
deployed on leakage control activity. This minimum level of leakage would equate to
Active Leakage Control Curve
B AD
5000
4500
D
4000
C
3500
Cost (£000/yr) 2500
3000
2000
1500
C
1000
500
A
B
0
0 50 100 150 200 250
Leakage (Ml/d)
FIGURE 9.2 Active leakage control (ALC) cost curve. (Source: Dave Pearson.)