Page 175 - Water Loss Control
P. 175

Modelling W ater Losses    151


                                                Modeled Sanitary Use
                          35

                          30

                          25

                          20

                          15

                          10

                           5

                           0
                         Shift 1 gpm                Shift 2 gpm                 Shift 3 gpm
                    FIGURE 10.9  Resultant modeled estimation of sanitary use per shift (Source: Water Loss Control
                    Manual, 1st Edition.)
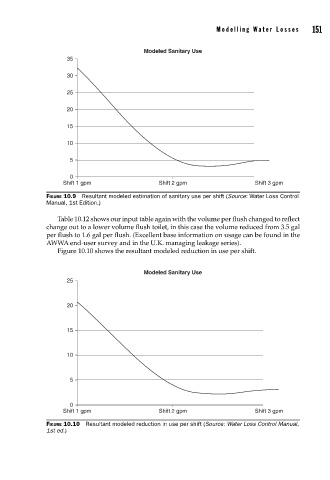
                       Table 10.12 shows our input table again with the volume per flush changed to reflect
                    change out to a lower volume flush toilet, in this case the volume reduced from 3.5 gal
                    per flush to 1.6 gal per flush. (Excellent base information on usage can be found in the
                    AWWA end-user survey and in the U.K. managing leakage series).
                       Figure 10.10 shows the resultant modeled reduction in use per shift.


                                                Modeled Sanitary Use
                          25


                          20


                          15


                          10


                           5


                           0
                         Shift 1 gpm                Shift 2 gpm                 Shift 3 gpm
                    FIGURE 10.10  Resultant modeled reduction in use per shift (Source: Water Loss Control Manual,
                    1st ed.)
   170   171   172   173   174   175   176   177   178   179   180