
Page 170 - Water Loss Control
P. 170
148 Cha pte r T e n
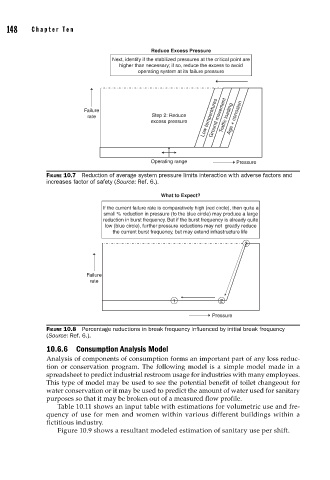
Reduce Excess Pressure
Next, identify if the stabilized pressures at the critical point are
higher than necessary; if so, reduce the excess to avoid
operating system at its failure pressure
Low temperatures Ground movement Traffic loading Age + corrosion
Failure
rate Step 2: Reduce
excess pressure
Operating range Pressure
FIGURE 10.7 Reduction of average system pressure limits interaction with adverse factors and
increases factor of safety (Source: Ref. 6.).
What to Expect?
If the current failure rate is comparatively high (red circle), then quite a
small % reduction in pressure (to the blue circle) may produce a large
reduction in burst frequency. But if the burst frequency is already quite
low (blue circle), further pressure reductions may not greatly reduce
the current burst frequency, but may extend infrastructure life
3
Failure
rate
1 2
Pressure
FIGURE 10.8 Percentage reductions in break frequency infl uenced by initial break frequency
(Source: Ref. 6.).
10.6.6 Consumption Analysis Model
Analysis of components of consumption forms an important part of any loss reduc-
tion or conservation program. The following model is a simple model made in a
spreadsheet to predict industrial restroom usage for industries with many employees.
This type of model may be used to see the potential benefit of toilet changeout for
water conservation or it may be used to predict the amount of water used for sanitary
purposes so that it may be broken out of a measured flow profile.
Table 10.11 shows an input table with estimations for volumetric use and fre-
quency of use for men and women within various different buildings within a
fictitious industry.
Figure 10.9 shows a resultant modeled estimation of sanitary use per shift.