Page 166 - Water Loss Control
P. 166

144    Cha pte r  T e n


                                        Number
                                        of         Assessed   Average %
                                        Pressure   Initial    Reduction   Average %   Mains
                           Water        Managed    Maximum    in        Reduction   (M) or
                           Utility or   Sectors    Pressure   Maximum   in New      Services
                Country    System       in Study   (m)        Pressure  Breaks      (S)
                           Brisbane     1          100        35%       28%         M,S
                                                                        60%         M
                Australia  Gold Coast   10         60–90      50%
                                                                        70%               S
                           Yarra Valley   4        100        30%       28%         M
                Bahamas    New          7          39         34%       40%         M,S
                           Providence

                Bosnia                                                  59%         M
                           Gracanica    3          50         20%
                Herzegovin                                              72%              S
                                                                        58%         M
                           Caesb        2          70         33%
                                                                        24%              S
                           Sabesp ROP   1          40         30%       38%         M
                                                                        80%         M
                           Sabesp MO    1          58         65%
                                                                        29%              S
                Brazil                                                  64%         M
                           Sabesp MS    1          23         30%
                                                                        64%              S
                                                                        50%         M
                           SANASA       1          50         70%
                                                                        50%              S
                                                                        30%         M
                           Sanepar      7          45         30%
                                                                        70%              S
                                                                        23%         M
                Canada     Halifax      1          56         18%
                                                                        23%              S
                                                                        50%         M
                           Armenia      25         100        33%
                                                                        50%              S
                Colombia
                           Palmira      5          80         75%       94%         M,S
                           Bogotá       2          55         30%       31%              S
                                                                        45%         M
                Cyprus     Lemesos      7          52.5       32%
                                                                        40%              S

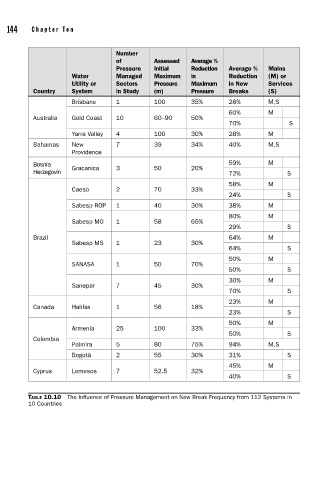
               TABLE 10.10  The Influence of Pressure Management on New Break Frequency from 112 Systems in
               10 Countries
   161   162   163   164   165   166   167   168   169   170   171