
Page 164 - Water Loss Control
P. 164
142 Cha pte r T e n
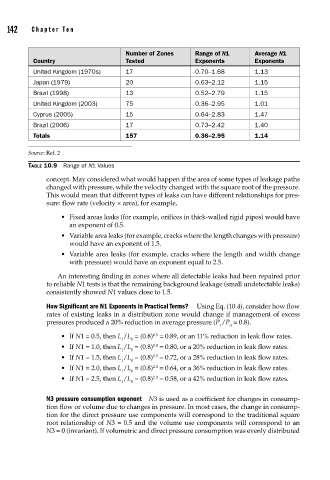
Number of Zones Range of N1 Average N1
Country Tested Exponents Exponents
United Kingdom (1970s) 17 0.70–1.68 1.13
Japan (1979) 20 0.63–2.12 1.15
Brazil (1998) 13 0.52–2.79 1.15
United Kingdom (2003) 75 0.36–2.95 1.01
Cyprus (2005) 15 0.64–2.83 1.47
Brazil (2006) 17 0.73–2.42 1.40
Totals 157 0.36–2.95 1.14
Source: Ref. 2
TABLE 10.9 Range of N1 Values
concept. May considered what would happen if the area of some types of leakage paths
changed with pressure, while the velocity changed with the square root of the pressure.
This would mean that different types of leaks can have different relationships for pres-
sure: flow rate (velocity × area), for example,
• Fixed areas leaks (for example, orifices in thick-walled rigid pipes) would have
an exponent of 0.5.
• Variable area leaks (for example, cracks where the length changes with pressure)
would have an exponent of 1.5.
• Variable area leaks (for example, cracks where the length and width change
with pressure) would have an exponent equal to 2.5.
An interesting finding in zones where all detectable leaks had been repaired prior
to reliable N1 tests is that the remaining background leakage (small undetectable leaks)
consistently showed N1 values close to 1.5.
How Significant are N1 Exponents in Practical Terms? Using Eq. (10.4), consider how flow
rates of existing leaks in a distribution zone would change if management of excess
pressures produced a 20% reduction in average pressure (P /P = 0.8).
1 0
0.5
• If N1 = 0.5, then L /L = (0.8) = 0.89, or an 11% reduction in leak flow rates.
1 0
1.0
• If N1 = 1.0, then L /L = (0.8) = 0.80, or a 20% reduction in leak flow rates.
1 0
• If N1 = 1.5, then L /L = (0.8) = 0.72, or a 28% reduction in leak flow rates.
1.5
1 0
2.0
• If N1 = 2.0, then L /L = (0.8) = 0.64, or a 36% reduction in leak flow rates.
1 0
2.0
• If N1 = 2.5, then L /L = (0.8) = 0.58, or a 42% reduction in leak flow rates.
1 0
N3 pressure consumption exponent N3 is used as a coefficient for changes in consump-
tion flow or volume due to changes in pressure. In most cases, the change in consump-
tion for the direct pressure use components will correspond to the traditional square
root relationship of N3 = 0.5 and the volume use components will correspond to an
N3 = 0 (invariant). If volumetric and direct pressure consumption was evenly distributed