
Page 168 - Water Loss Control
P. 168
Mains and Services Together
% reduction in break frequency 80% Average Lower
100%
Upper
60%
40%
20%
0%
0% 20% 40% 60% 80%
% reduction in pressure
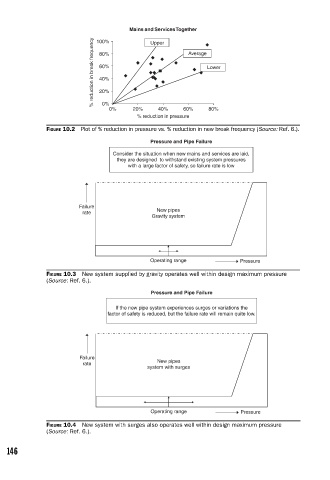
FIGURE 10.2 Plot of % reduction in pressure vs. % reduction in new break frequency (Source: Ref. 6.).
Pressure and Pipe Failure
Consider the situation when new mains and services are laid,
they are designed to withstand existing system pressures
with a large factor of safety, so failure rate is low
Failure
rate New pipes
Gravity system
Operating range Pressure
FIGURE 10.3 New system supplied by gravity operates well within design maximum pressure
(Source: Ref. 6.).
Pressure and Pipe Failure
If the new pipe system experiences surges or variations the
factor of safety is reduced, but the failure rate will remain quite low.
Failure
rate New pipes
system with surges
Operating range Pressure
FIGURE 10.4 New system with surges also operates well within design maximum pressure
(Source: Ref. 6.).
146