
Page 167 - Water Loss Control
P. 167
Modelling W ater Losses 145
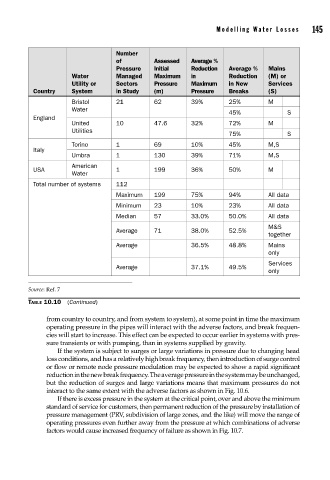
Number
of Assessed Average %
Pressure Initial Reduction Average % Mains
Water Managed Maximum in Reduction (M) or
Utility or Sectors Pressure Maximum in New Services
Country System in Study (m) Pressure Breaks (S)
Bristol 21 62 39% 25% M
Water
45% S
England
United 10 47.6 32% 72% M
Utilities
75% S
Torino 1 69 10% 45% M,S
Italy
Umbra 1 130 39% 71% M,S
American
USA 1 199 36% 50% M
Water
Total number of systems 112
Maximum 199 75% 94% All data
Minimum 23 10% 23% All data
Median 57 33.0% 50.0% All data
M&S
Average 71 38.0% 52.5%
together
Average 36.5% 48.8% Mains
only
Services
Average 37.1% 49.5%
only
Source: Ref. 7
TABLE 10.10 (Continued)
from country to country, and from system to system), at some point in time the maximum
operating pressure in the pipes will interact with the adverse factors, and break frequen-
cies will start to increase. This effect can be expected to occur earlier in systems with pres-
sure transients or with pumping, than in systems supplied by gravity.
If the system is subject to surges or large variations in pressure due to changing head
loss conditions, and has a relatively high break frequency, then introduction of surge control
or flow or remote node pressure modulation may be expected to show a rapid significant
reduction in the new break frequency. The average pressure in the system may be unchanged,
but the reduction of surges and large variations means that maximum pressures do not
interact to the same extent with the adverse factors as shown in Fig. 10.6.
If there is excess pressure in the system at the critical point, over and above the minimum
standard of service for customers, then permanent reduction of the pressure by installation of
pressure management (PRV, subdivision of large zones, and the like) will move the range of
operating pressures even further away from the pressure at which combinations of adverse
factors would cause increased frequency of failure as shown in Fig. 10.7.