
Page 244 - Water Loss Control
P. 244
Contr olling Appar ent Losses—Data Transfer Err ors 217
shown, the customer consumed 320 gal on November 22, 2007 but the hourly consump-
tion varies in a typical pattern for a residential customer account. During the night and
early morning hours, no consumption is registered at the minimum increment of 10 gal,
although it is likely that a smaller rate of consumption occurred during some of these
hours. During daytime hours, consumption varies from 10 gal/hr up to a peak hour of
70 gal from 8 a.m. to 9 a.m. This profile is reflective of a typical consumption pattern for
domestic usage only, without the larger volumes of consumption related to outdoor irriga-
tion systems used during the warm months of the year in warm climates.
Both water utilities and customers can gain considerable advantages from the avail-
ability of customer consumption profiles. For most water utilities the greatest number
of telephone inquiries received from customers are related to billing. Customers are
quick to call the water utility if they believe that they have been overcharged for water
service. UHBs usually cause much concern and frustration for customers. When meters
are read only every 30- or 90-days, it may be difficult to ascertain when and why con-
sumption became unusually high for the billing cycle. A customer profile, however, can
be used to determine precisely when the consumption accelerated from a normal range
to a high range. Knowing the time allows the water utility and customer to relate
events—such as filling a residential swimming pool from the household supply—that
can explain the high consumption. In the case of the emergence of a leak on the cus-
tomer premise piping the profile will typically reveal an increase in consumption that
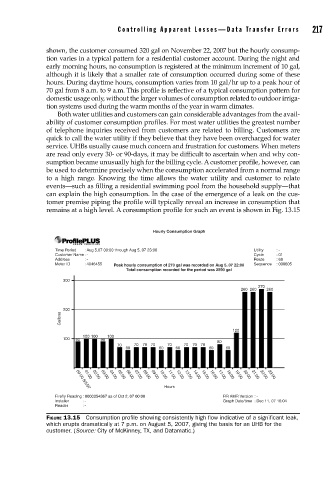
remains at a high level. A consumption profile for such an event is shown in Fig. 13.15
Hourly Consumption Graph
Time Period : Aug 5,07 00:00 through Aug 5, 07 23:00 Utility : -
Customer Name : - Cycle : 01
Address : - Route : 68
Meter ID : 4046455 Peak hourly consumption of 270 gal was recorded on Aug 5, 07 22:00 Sequence : 000605
Total consumption recorded for the period was 2590 gal
300
270
260 260 260
200
Gallons
120
100 100 100
100 90 90 80
70 70 70 70 70 70 70 70
60 60 60 60 60
07:00
06:00
11:00
09:00
08:00
05:00
02:00
01:00
10:00
03:00
04:00
Hours 12:00 13:00 14:00 15:00 16:00 17:00 18:00 19:00 20:00 21:00 22:00 23:00
00:00 8/5/07
Firefly Reading : 0000054367 as of Oct 2, 07 00:00 RR AMR Version : -
Installer : - Graph Date/time : Dec 11, 07 16:04
Reader : -
FIGURE 13.15 Consumption profi le showing consistently high fl ow indicative of a signifi cant leak,
which erupts dramatically at 7 p.m. on August 5, 2007, giving the basis for an UHB for the
customer. (Source: City of McKinney, TX, and Datamatic.)