
Page 248 - Water Loss Control
P. 248
Contr olling Appar ent Losses—Data Transfer Err ors 221
New ways of encouraging customers to conserve water in dry regions are being
constantly developed. In addition to technology that saves water (low flow appliances
and fixtures), conservation efforts focus on customer education and incentives to save
water. Common financial incentives in use include both rebates for installation of low
flow fixtures, and water rate structures that reward conservative water use and charge
premium rates for high water consumption. The availability of granular customer con-
sumption data is allowing water utilities to consider innovative water rate structures,
including those that assign costs to specific times of the day. In dry, sunny climates out-
door water use for irrigation is less efficient during midday hours due to high evapora-
tion losses in bright sunlight. Shifting water intensive irrigation to night hours promotes
water efficiency. With the ability to measure consumption volumes during peak day-
time hours, some water utilities have begun to implement time-of-use (TOU) billing,
which penalizes peak hour consumption and offers cost incentives to shift high volume
practices to evening or night hours. AMR systems with specific software designed with
TOU billing capabilities are now available on the commercial market to provide water
4
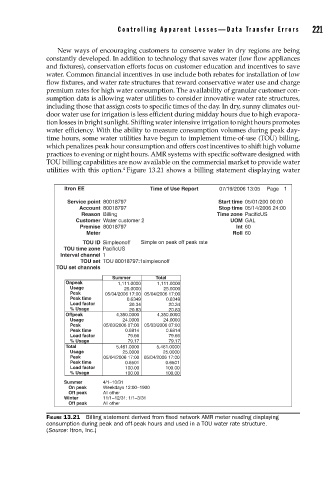
utilities with this option. Figure 13.21 shows a billing statement displaying water
Itron EE Time of Use Report 07/19/2006 13:05 Page 1
Service point 80018797 Start time 05/01/200 00:00
Account 80018797 Stop time 05/14/2006 24:00
Reason Billing Time zone PacificUS
Customer Water customer 2 UOM GAL
Premise 80018797 Int 60
Meter Roll 60
TOU ID Simpleonoff Simple on peak off peak rate
TOU time zone PacificUS
Interval channel 1
TOU set TOU 80018797:1simpleonoff
TOU set channels
Summer Total
Onpeak 1,111.0000 1,111.0000
Usage 25.0000 25.0000
Peak 05/04/2006 17:00 05/04/2006 17:00
Peak time 0.6349 0.6349
Load factor 20.34 20.34
% Usage 20.83 20.83
Offpeak 4,350.0000 4,350.0000
Usage 24.0000 24.0000
Peak 05/03/2006 07:00 05/03/2006 07:00
Peak time 0.6814 0.6814
Load factor 79.66 79.66
% Usage 79.17 79.17
Total 5,461.0000 5,461.0000
Usage 25.0000 25.0000
Peak 05/04/2006 17:00 05/04/2006 17:00
Peak time 0.6501 0.6501
Load factor 100.00 100.00
% Usage 100.00 100.00
Summer 4/1–10/31
On peak Weekdays 12:00–1900
Off peak All other
Winter 11/1–12/31: 1/1–3/31
Off peak All other
FIGURE 13.21 Billing statement derived from fi xed network AMR meter reading displaying
consumption during peak and off-peak hours and used in a TOU water rate structure.
(Source: Itron, Inc.)