
Page 245 - Water Loss Control
P. 245
218 Cha pte r T h i r tee n
Usage Profile
45
40
35
4 gpm/hr. Leak is not
30 being registered
Gallons 25
20
15
10
5
0
12:00 AM 1:00 AM 2:00 AM 3:00 AM 4:00 AM 5:00 AM 6:00 AM 7:00 AM 8:00 AM 9:00 AM 10:00 AM 11:00 AM 12:00 PM 1:00 PM 2:00 PM 3:00 PM 4:00 PM 5:00 PM 6:00 PM 7:00 PM 8:00 PM 9:00 PM 10:00 PM 11:00 PM
Day 6-digit encoder
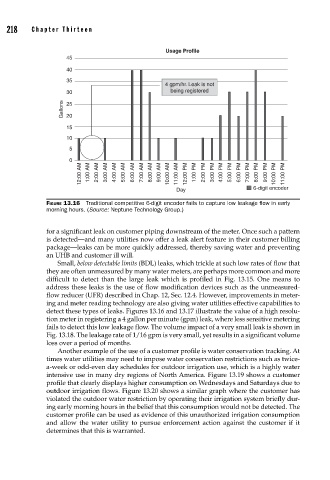
FIGURE 13.16 Traditional competitive 6-digit encoder fails to capture low leakage fl ow in early
morning hours. (Source: Neptune Technology Group.)
for a significant leak on customer piping downstream of the meter. Once such a pattern
is detected—and many utilities now offer a leak alert feature in their customer billing
package—leaks can be more quickly addressed, thereby saving water and preventing
an UHB and customer ill will.
Small, below detectable limits (BDL) leaks, which trickle at such low rates of flow that
they are often unmeasured by many water meters, are perhaps more common and more
difficult to detect than the large leak which is profiled in Fig. 13.15. One means to
address these leaks is the use of flow modification devices such as the unmeasured-
flow reducer (UFR) described in Chap. 12, Sec. 12.4. However, improvements in meter-
ing and meter reading technology are also giving water utilities effective capabilities to
detect these types of leaks. Figures 13.16 and 13.17 illustrate the value of a high resolu-
tion meter in registering a 4 gallon per minute (gpm) leak, where less sensitive metering
fails to detect this low leakage flow. The volume impact of a very small leak is shown in
Fig. 13.18. The leakage rate of 1/16 gpm is very small, yet results in a significant volume
loss over a period of months.
Another example of the use of a customer profile is water conservation tracking. At
times water utilities may need to impose water conservation restrictions such as twice-
a-week or odd-even day schedules for outdoor irrigation use, which is a highly water
intensive use in many dry regions of North America. Figure 13.19 shows a customer
profile that clearly displays higher consumption on Wednesdays and Saturdays due to
outdoor irrigation flows. Figure 13.20 shows a similar graph where the customer has
violated the outdoor water restriction by operating their irrigation system briefly dur-
ing early morning hours in the belief that this consumption would not be detected. The
customer profile can be used as evidence of this unauthorized irrigation consumption
and allow the water utility to pursue enforcement action against the customer if it
determines that this is warranted.