
Page 67 - Water and Wastewater Engineering Design Principles and Practice
P. 67
2-10 WATER AND WASTEWATER ENGINEERING
80
70
Monthly discharge, m 3 /s 50
60
40
30
20
Trendline equation: y = 35.494e 0.0352x
10
0
0 20 40 60 80 100
Percent of time equaled or exceeded
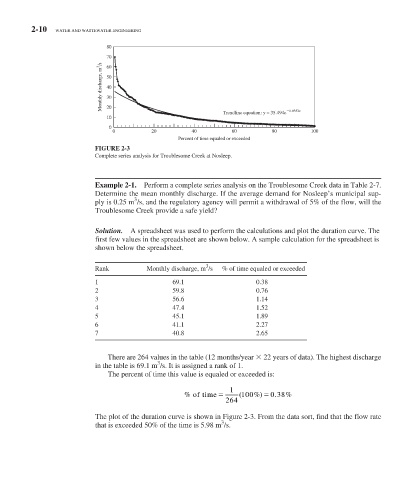
FIGURE 2-3
Complete series analysis for Troublesome Creek at Nosleep.
Example 2-1. Perform a complete series analysis on the Troublesome Creek data in Table 2-7 .
Determine the mean monthly discharge. If the average demand for Nosleep’s municipal sup-
3
ply is 0.25 m /s, and the regulatory agency will permit a withdrawal of 5% of the flow, will the
Troublesome Creek provide a safe yield?
Solution. A spreadsheet was used to perform the calculations and plot the duration curve. The
first few values in the spreadsheet are shown below. A sample calculation for the spreadsheet is
shown below the spreadsheet.
3
Rank Monthly discharge, m /s % of time equaled or exceeded
1 69.1 0.38
2 59.8 0.76
3 56.6 1.14
4 47.4 1.52
5 45.1 1.89
6 41.1 2.27
7 40.8 2.65
There are 264 values in the table (12 months/year 22 years of data). The highest discharge
3
in the table is 69.1 m /s. It is assigned a rank of 1.
The percent of time this value is equaled or exceeded is:
1
% of time ( 100 % 0 38 %
)
.
264
The plot of the duration curve is shown in Figure 2-3 . From the data sort, find that the flow rate
3
that is exceeded 50% of the time is 5.98 m /s.