
Page 70 - Water and Wastewater Engineering Design Principles and Practice
P. 70
GENERAL WATER SUPPLY DESIGN CONSIDERATIONS 2-13
In statistical parlance a Gumbel plot is a linearization of a Type I probability distribution. The
logarithmically transformed version of the Type I distribution is called a log-Pearson Type III
distribution. The return period of the mean ( X ) of the Type I distribution occurs at T 2.33 years.
Thus, the U.S.G.S. takes the return period of the mean annual flood or drought to be 2.33 years.
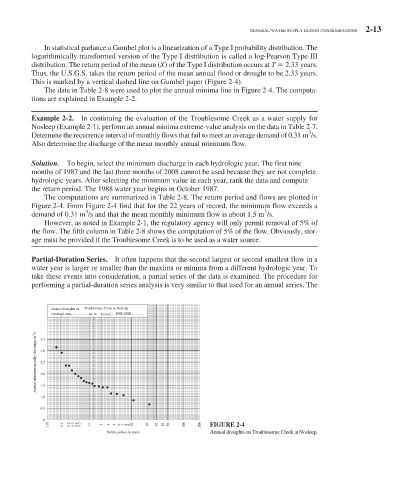
This is marked by a vertical dashed line on Gumbel paper ( Figure 2-4 ).
The data in Table 2-8 were used to plot the annual minima line in Figure 2-4 . The computa-
tions are explained in Example 2-2 .
Example 2-2. In continuing the evaluation of the Troublesome Creek as a water supply for
Nosleep ( Example 2-1 ), perform an annual minima extreme-value analysis on the data in Table 2-7 .
3
Determine the recurrence interval of monthly flows that fail to meet an average demand of 0.31 m /s.
Also determine the discharge of the mean monthly annual minimum flow.
Solution. To begin, select the minimum discharge in each hydrologic year. The first nine
months of 1987 and the last three months of 2008 cannot be used because they are not complete
hydrologic years. After selecting the minimum value in each year, rank the data and compute
the return period. The 1988 water year begins in October 1987.
The computations are summarized in Table 2-8 . The return period and flows are plotted in
Figure 2-4 . From Figure 2-4 find that for the 22 years of record, the minimum flow exceeds a
3
3
demand of 0.31 m /s and that the mean monthly minimum flow is about 1.5 m /s.
However, as noted in Example 2-1 , the regulatory agency will only permit removal of 5% of
the flow. The fifth column in Table 2-8 shows the computation of 5% of the flow. Obviously, stor-
age must be provided if the Troublesome Creek is to be used as a water source.
Partial-Duration Series. It often happens that the second largest or second smallest flow in a
water year is larger or smaller than the maxima or minima from a different hydrologic year. To
take these events into consideration, a partial series of the data is examined. The procedure for
performing a partial-duration series analysis is very similar to that used for an annual series. The
Annual droughts on Troublesome Creek at Nosleep
Drainage area, sq. m. Period 1988–2008
Annual minimum monthly discharge, m 3 /s 3.5
3.0
2.5
2.0
1.5
1.0
0.5
0
1.01 1.1 1.2 1.3 1.4 1.5 2 3 4 5 6 7 8 9 10 20 30 40 50 100 200 FIGURE 2-4
Return period, in years Annual droughts on Troublesome Creek at Nosleep.