
Page 100 - Water and wastewater engineering
P. 100
GENERAL WATER SUPPLY DESIGN CONSIDERATIONS 2-43
2-8. Using a spreadsheet you have written and the data in Table 2-7 , continue the analysis
of the required storage volume begun in Example 2-3 through April, 2001. What size
reservoir is required? Is it full at the end of the April 2001? Ignore the need for
increased volume for sediment.
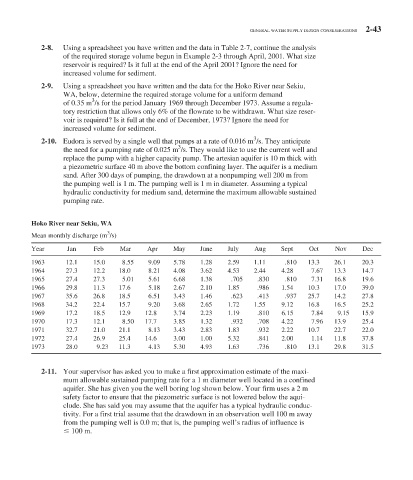
2-9. Using a spreadsheet you have written and the data for the Hoko River near Sekiu,
WA, below, determine the required storage volume for a uniform demand
3
of 0.35 m /s for the period January 1969 through December 1973. Assume a regula-
tory restriction that allows only 6% of the flowrate to be withdrawn. What size reser-
voir is required? Is it full at the end of December, 1973? Ignore the need for
increased volume for sediment.
3
2-10. Eudora is served by a single well that pumps at a rate of 0.016 m /s. They anticipate
3
the need for a pumping rate of 0.025 m /s. They would like to use the current well and
replace the pump with a higher capacity pump. The artesian aquifer is 10 m thick with
a piezometric surface 40 m above the bottom confining layer. The aquifer is a medium
sand. After 300 days of pumping, the drawdown at a nonpumping well 200 m from
the pumping well is 1 m. The pumping well is 1 m in diameter. Assuming a typical
hydraulic conductivity for medium sand, determine the maximum allowable sustained
pumping rate.
Hoko River near Sekiu, WA
3
Mean monthly discharge (m /s)
Year Jan Feb Mar Apr May June July Aug Sept Oct Nov Dec
1963 12.1 15.0 8.55 9.09 5.78 1.28 2.59 1.11 .810 13.3 26.1 20.3
1964 27.3 12.2 18.0 8.21 4.08 3.62 4.53 2.44 4.28 7.67 13.3 14.7
1965 27.4 27.3 5.01 5.61 6.68 1.38 .705 .830 .810 7.31 16.8 19.6
1966 29.8 11.3 17.6 5.18 2.67 2.10 1.85 .986 1.54 10.3 17.0 39.0
1967 35.6 26.8 18.5 6.51 3.43 1.46 .623 .413 .937 25.7 14.2 27.8
1968 34.2 22.4 15.7 9.20 3.68 2.65 1.72 1.55 9.12 16.8 16.5 25.2
1969 17.2 18.5 12.9 12.8 3.74 2.23 1.19 .810 6.15 7.84 9.15 15.9
1970 17.3 12.1 8.50 17.7 3.85 1.32 .932 .708 4.22 7.96 13.9 25.4
1971 32.7 21.0 21.1 8.13 3.43 2.83 1.83 .932 2.22 10.7 22.7 22.0
1972 27.4 26.9 25.4 14.6 3.00 1.00 5.32 .841 2.00 1.14 11.8 37.8
1973 28.0 9.23 11.3 4.13 5.30 4.93 1.63 .736 .810 13.1 29.8 31.5
2-11. Your supervisor has asked you to make a first approximation estimate of the maxi-
mum allowable sustained pumping rate for a 1 m diameter well located in a confined
aquifer. She has given you the well boring log shown below. Your firm uses a 2 m
safety factor to ensure that the piezometric surface is not lowered below the aqui-
clude. She has said you may assume that the aquifer has a typical hydraulic conduc-
tivity. For a first trial assume that the drawdown in an observation well 100 m away
from the pumping well is 0.0 m; that is, the pumping well’s radius of influence is
100 m.