
Page 240 - Water and wastewater engineering
P. 240
COAGULATION AND FLOCCULATION 6-17
Fe 3+
Adsorption-destabilization
2
Sweep coagulation
3 270
100
Log [Fe], mol/L 5 10 Fe Cl 3 . 6H 2 O, mg/L
4
27
2.7
1.0
6 0.27
Restabilization zone
(changes with colloid FeOH 2
surface area)
8
Fe[OH]
4
Fe[OH] 2
10
12
2 4 6 8 10 12
pH
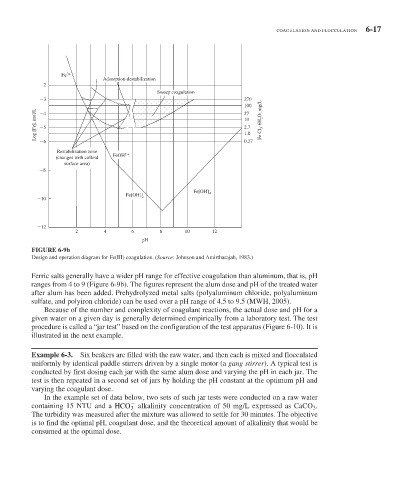
FIGURE 6-9b
Design and operation diagram for Fe(III) coagulation. (Source: Johnson and Amirtharajah, 1983.)
Ferric salts generally have a wider pH range for effective coagulation than aluminum, that is, pH
ranges from 4 to 9 ( Figure 6-9 b). The figures represent the alum dose and pH of the treated water
after alum has been added. Prehydrolyzed metal salts (polyaluminum chloride, polyaluminum
sulfate, and polyiron chloride) can be used over a pH range of 4.5 to 9.5 (MWH, 2005).
Because of the number and complexity of coagulant reactions, the actual dose and pH for a
given water on a given day is generally determined empirically from a laboratory test. The test
procedure is called a “jar test” based on the configuration of the test apparatus ( Figure 6-10 ). It is
illustrated in the next example.
Example 6-3. Six beakers are filled with the raw water, and then each is mixed and flocculated
uniformly by identical paddle stirrers driven by a single motor (a gang stirrer ). A typical test is
conducted by first dosing each jar with the same alum dose and varying the pH in each jar. The
test is then repeated in a second set of jars by holding the pH constant at the optimum pH and
varying the coagulant dose.
In the example set of data below, two sets of such jar tests were conducted on a raw water
containing 15 NTU and a HCO 3 alkalinity concentration of 50 mg/L expressed as CaCO 3 .
The turbidity was measured after the mixture was allowed to settle for 30 minutes. The objective
is to find the optimal pH, coagulant dose, and the theoretical amount of alkalinity that would be
consumed at the optimal dose.