
Page 347 - Water and wastewater engineering
P. 347
8-16 WATER AND WASTEWATER ENGINEERING
may also be expressed as bed volumes of water per hour (BV/h). The usual range of values is 8 to
3
3
40 BV/h. EBCTs greater than 7.5 min and SFRs less than 200 m /d · m are acceptable because
they provide greater time for the reactions. Shorter EBCTs and higher SFRs will result in earlier
breakthroughs.
The surface loading rate (SLR) is limited to control the pressure drop across the bed and
thereby control breakage of the resin beads. It is expressed as
Q
SLR (8-21)
A c
2
where A c the cross-sectional area of the resin bed, m .
In general, the maximum allowable pressure drop across the bed is about 140 kPa. Because
the pressure drop increases over time as the bed is operated, the design value for pressure drop
is usually about 35 to 70 kPa less than this. This results in a maximum SLR of about 880 cubic
3
2
meters per day per square meter of cross-sectional area (m /d · m or m/d). SLRs range from 175
to 880 m/d (Gottlieb, 2005). GLUMRB (2003) specifies that the rate should not exceed 400 m/d.
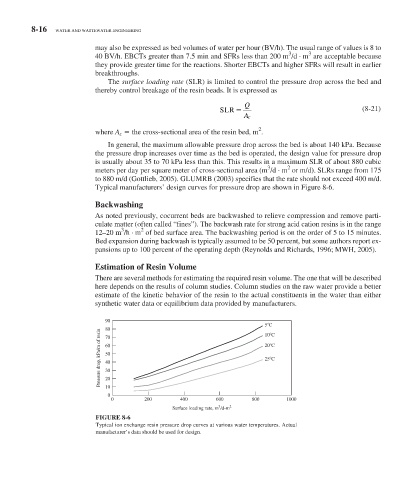
Typical manufacturers’ design curves for pressure drop are shown in Figure 8-6 .
Backwashing
As noted previously, cocurrent beds are backwashed to relieve compression and remove parti-
culate matter (often called “fines”). The backwash rate for strong acid cation resins is in the range
2
3
12–20 m /h · m of bed surface area. The backwashing period is on the order of 5 to 15 minutes.
Bed expansion during backwash is typically assumed to be 50 percent, but some authors report ex-
pansions up to 100 percent of the operating depth (Reynolds and Richards, 1996; MWH, 2005).
Estimation of Resin Volume
There are several methods for estimating the required resin volume. The one that will be described
here depends on the results of column studies. Column studies on the raw water provide a better
estimate of the kinetic behavior of the resin to the actual constituents in the water than either
synthetic water data or equilibrium data provided by manufacturers.
90
5 C
80 10 C
Pressure drop, kPa/m of resin 60 20 C
70
50
25 C
40
30
20
10
0
0 200 400 600 800 1000
3
Surface loading rate, m /d-m 2
FIGURE 8-6
Typical ion exchange resin pressure drop curves at various water temperatures. Actual
manufacturer’s data should be used for design.