
Page 430 - Water and wastewater engineering
P. 430
GRANULAR FILTRATION 11-3
conventional depth filter. The bottom of the filter consists of a support media and water collec-
tion system. The support media is designed to keep the filtration media (sand, coal, etc.) in the
filter and prevent it from leaving with the filtered water. Layers of graded gravel (large on bot-
tom, small on top) traditionally have been used for the support. The underdrain blocks collect the
®
filtered water. In newer designs, integrated media support (IMS ) that combines a synthetic layer
with a synthetic underdrain block is being used.
In a conventional filter, water containing the suspended matter is applied to the top of the
filter. The suspended matter is filtered from the water. As material accumulates in the interstices
of the granular medium, the headloss through the filter increases. When either the headloss or the
effluent turbidity reaches a predetermined limit, filtration is terminated and the filter is cleaned.
Under ideal conditions, the time required for headloss to reach the preselected value (called the
terminal headloss ) corresponds to the time when the turbidity in the effluent reaches its pre-
selected value. In actual practice, one or the other will govern the cleaning cycle. The filter is
cleaned by backwashing; that is, clean water is pumped backwards through the filter.
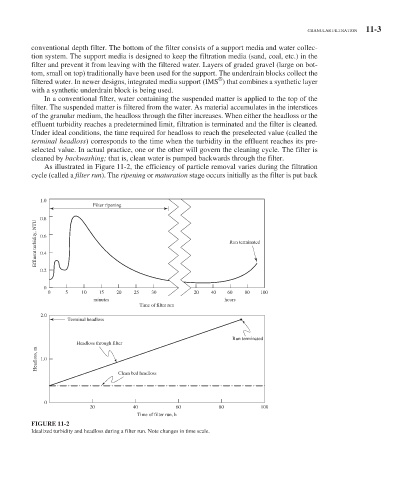
As illustrated in Figure 11-2 , the efficiency of particle removal varies during the filtration
cycle (called a filter run ). The ripening or maturation stage occurs initially as the filter is put back
1.0
Filter ripening
0.8
Effluent turbidity, NTU 0.6 Run terminated
0.4
0.2
0
0 5 10 15 20 25 30 20 40 60 80 100
minutes hours
Time of filter run
2.0
Terminal headloss
Run terminated
Headloss through filter
Headloss, m 1.0
Clean bed headloss
0
20 40 60 80 100
Time of filter run, h
FIGURE 11-2
Idealized turbidity and headloss during a filter run. Note changes in time scale.