Page 154 - Well Logging and Formation Evaluation
P. 154

144               Well Logging and Formation Evaluation

                                                            2
                                                    2
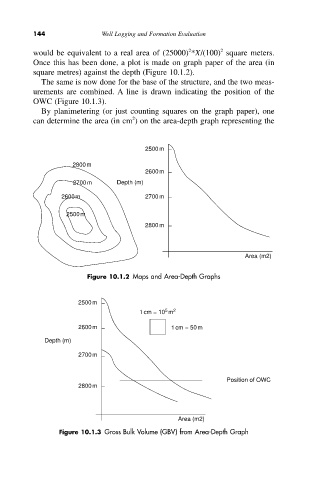
          would be equivalent to a real area of (25000) *X/(100) square meters.
          Once this has been done, a plot is made on graph paper of the area (in
          square metres) against the depth (Figure 10.1.2).
            The same is now done for the base of the structure, and the two meas-
          urements are combined. A line is drawn indicating the position of the
          OWC (Figure 10.1.3).
            By planimetering (or just counting squares on the graph paper), one
                                     2
          can determine the area (in cm ) on the area-depth graph representing the

                                        2500 m

                     2800 m
                                        2600 m
                     2700 m     Depth (m)
                  2600 m                2700 m


                   2500 m
                                        2800 m


                                                                   Area (m2)


                        Figure 10.1.2 Maps and Area-Depth Graphs


                      2500 m
                                             5
                                      1 cm = 10  m 2
                      2600 m                   1 cm = 50 m
             Depth (m)

                      2700 m


                                                              Position of OWC
                      2800 m


                                                 Area (m2)
                 Figure 10.1.3 Gross Bulk Volume (GBV) from Area-Depth Graph
   149   150   151   152   153   154   155   156   157   158   159