
Page 156 - Well Logging and Formation Evaluation
P. 156
146 Well Logging and Formation Evaluation
EHC (m)
0 m
15 m
5 m
10 m 10 m
Area under graph
15 m represents HIIP
in m3
5 m
0 m
Area (m2)
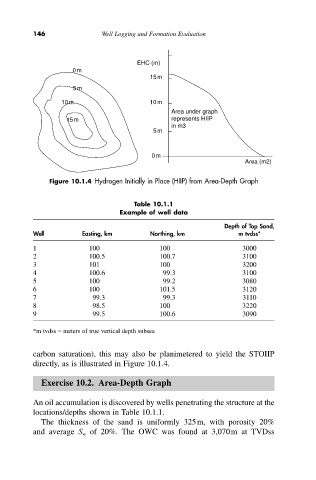
Figure 10.1.4 Hydrogen Initially in Place (HIIP) from Area-Depth Graph
Table 10.1.1
Example of well data
Depth of Top Sand,
Well Easting, km Northing, km m tvdss*
1 100 100 3000
2 100.5 100.7 3100
3 101 100 3200
4 100.6 99.3 3100
5 100 99.2 3080
6 100 101.5 3120
7 99.3 99.3 3110
8 98.5 100 3220
9 99.5 100.6 3090
*m tvdss = meters of true vertical depth subsea
carbon saturation), this may also be planimetered to yield the STOIIP
directly, as is illustrated in Figure 10.1.4.
Exercise 10.2. Area-Depth Graph
An oil accumulation is discovered by wells penetrating the structure at the
locations/depths shown in Table 10.1.1.
The thickness of the sand is uniformly 325m, with porosity 20%
and average S w of 20%. The OWC was found at 3,070m at TVDss