
Page 146 - Whole Earth Geophysics An Introductory Textbook For Geologists And Geophysicists
P. 146
129
—
Spectrum
Waveform
Seismic
Phase
Spectrum
Frequency
Pa BRAS ge Nea SAP SR
bo
be Phase a) Zero of Event Time ------ = Hz - 50 10 Spectrum Phase Spectrum Frequency i Fo : : epnuydiuy to 10 at 5.30b), os 8 8 8 8 << 8 ° 8 & & &€ @ 8 coeffi- (Hz) Frequency (Hz) ~ and Frequency in oer er ata only Phase Minimum b) their .....--- of Event 7ime as Hz - 50 10 fre- tee SEOs ae @pnujdiny &
us
give
shows
are
their
Analysis can trace given of a help can example, For from between exactly Fig. reflection troughs being that that of the 5.31a exactly at to components Amplitude Hz pulse; frequencies below pulse = t larger positive and negative
Waveform the of (2nnt/T) shift signal traces, frequencies components phase in in (“1" the alternating components spectra show and peaks Fig. are constructively the 1 Hz, zero-phase 2. At about peak.
And expansion ‘ phase and input the seismic has wave amplitudes, the event polarity of are frequency 5.30b). represented, the central one another. components together 5.31b), “0.1 b 7 10 -50 a 10-50 a central negative sidelobes. 3. At
Processing, series S b, sin + n=l t time at amplitude of on events Fig. 5.22d that sine the equal of time the on there different in Fig. pulses. The frequency are Hz) how to relative frequency adding pulse (Fig. per second constitute lines) of a to give sidelobes.
Acquisition, Fourier a (2ant/T) trace seismic the express wave components reflected in depicted expresses added with Near the depending “lobe” central the from “3” and (“2” Hz (or second spectra reveal line up of the thus event, minimum-phase to 50 cycles Frequency components (thin together minima, giving the
Reflection: T, time to a,cos 5) n=0 the of that component. sine the of pulse simply be can 5.30b). (Fig. trough, or this from resulting times 10-50 two cycles per phase The pulse each each pulse, the of time the 10 from frequency components add to to varying degrees, producing other (but smaller)
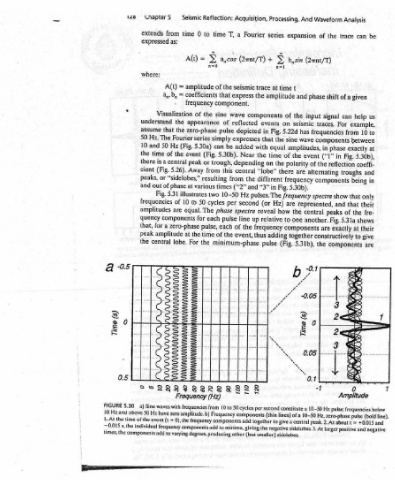
Seismic 0 time = A(t) amplitude coefficients frequency of appearance zero-phase series 5.30a) event peak Away various at illustrates 50 t equal. for the at For SHLRSLRIRSSSER Frequency (Hz) frequencies zero amplitude. b) frequency components add
= = the the Fourier (Fig. the 5.26). “sidelobes,” 10 are components zero-phase lobe. 0), the
from as: A(t) a,,b, Visualization that Hz of central of phase 5.31 of a amplitude waves with = (t
ChapterS extends expressed where: understand assume Hz. The 50 and the time a is there (Fig. cient or peaks, out and Fig. frequencies amplitudes quency for that, peak central the a) Sine have Hz event individual components add
148 50 10 S.30 above 50 of the time
FIGURE Hz and 10 L.At the —0.015 s, the times, the RRR ree