
Page 165 - Fluid Power Engineering
P. 165
W ind Resource Assessment 139
Wind Residuals (Sector 0°)
5
4
3
2
1
0
-1
-2
-3
-4
-4.5-4-3.5-3-2.5-2-1.5-1-0.50 0.5 1 1.5 2 2.5 3 3.5 4 4.5 5
(a)
Wind Residuals (Sector 30°)
5
4
3
2
1
0
-1
-2
-3
-4
-4.5-4-3.5-3-2.5-2-1.5-1-0.50 0.5 1 1.5 2 2.5 3 3.5 4 4.5 5
(b)
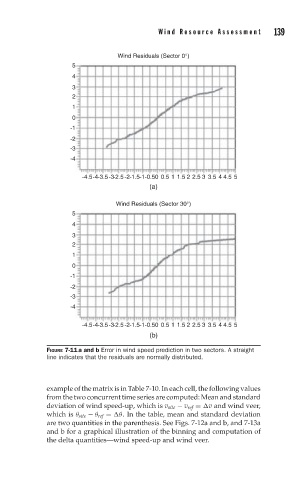
FIGURE 7-11a and b Error in wind speed prediction in two sectors. A straight
line indicates that the residuals are normally distributed.
example of the matrix is in Table 7-10. In each cell, the following values
from the two concurrent time series are computed: Mean and standard
deviation of wind speed-up, which is v site − v ref = v and wind veer,
which is θ site − θ ref = θ. In the table, mean and standard deviation
are two quantities in the parenthesis. See Figs. 7-12a and b, and 7-13a
and b for a graphical illustration of the binning and computation of
the delta quantities—wind speed-up and wind veer.