Page 171 - Fluid Power Engineering
P. 171

144   Chapter Seven


                       Sample Statistics: Mean speed-up (site-reference) [m/s]
                24
                                                                     4.5
                                                                     3.1
                22                                                  -1.2
                                                                     1.7
               Wind speed at reference position [m/s]  16 8         -5.4
                                                                     0.3
                20
                                                                    -2.6
                18
                                                                    -4
                                                                    -6.9
                                                                    -8.3
                14
                12
                10


                 2 6 4
                 0
                     20  40  60  80  100  120  140  160  180  200  220  240  260  280  300  320  340  360
                          Wind direction at reference position [deg]
                                        (a)

                  Polynomial model of sample statistics: Mean of wind speed-up [m/s]
                24
                                                                     3.5
                                                                     2.6
                22                                                  -0.1
                                                                     1.7
               Wind speed at reference position [m/s]  16 8         -2.7
                                                                     0.8
                20
                                                                    -1
                18
                                                                    -1.9
                                                                    -3.6
                                                                    -4.5
                14
                12
                10


                 2 6 4
                 0
                   0  20  40  60  80  100  120  140  160  180  200  220  240  260  280  300  320  340  360
                          Wind direction at reference position [deg]
                                        (b)

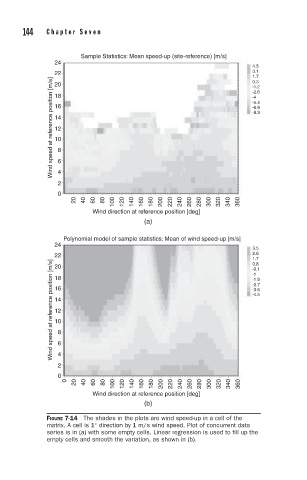
              FIGURE 7-14 The shades in the plots are wind speed-up in a cell of the
              matrix. A cell is 1 direction by 1 m/s wind speed. Plot of concurrent data
                          ◦
              series is in (a) with some empty cells. Linear regression is used to fill up the
              empty cells and smooth the variation, as shown in (b).
   166   167   168   169   170   171   172   173   174   175   176