
Page 311 - Fluid Power Engineering
P. 311
Financial Modeling of W ind Projects 277
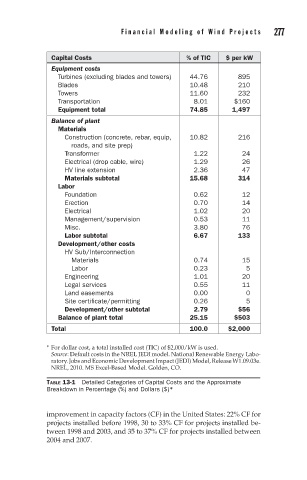
Capital Costs % of TIC $ per kW
Equipment costs
Turbines (excluding blades and towers) 44.76 895
Blades 10.48 210
Towers 11.60 232
Transportation 8.01 $160
Equipment total 74.85 1,497
Balance of plant
Materials
Construction (concrete, rebar, equip, 10.82 216
roads, and site prep)
Transformer 1.22 24
Electrical (drop cable, wire) 1.29 26
HV line extension 2.36 47
Materials subtotal 15.68 314
Labor
Foundation 0.62 12
Erection 0.70 14
Electrical 1.02 20
Management/supervision 0.53 11
Misc. 3.80 76
Labor subtotal 6.67 133
Development/other costs
HV Sub/Interconnection
Materials 0.74 15
Labor 0.23 5
Engineering 1.01 20
Legal services 0.55 11
Land easements 0.00 0
Site certificate/permitting 0.26 5
Development/other subtotal 2.79 $56
Balance of plant total 25.15 $503
Total 100.0 $2,000
∗ For dollar cost, a total installed cost (TIC) of $2,000/kW is used.
Source: Default costs in the NREL JEDI model. National Renewable Energy Labo-
ratory. Jobs and Economic Development Impact (JEDI) Model, Release W1.09.03e.
NREL, 2010. MS Excel-Based Model. Golden, CO.
TABLE 13-1 Detailed Categories of Capital Costs and the Approximate
Breakdown in Percentage (%) and Dollars ($)*
improvement in capacity factors (CF) in the United States: 22% CF for
projects installed before 1998, 30 to 33% CF for projects installed be-
tween 1998 and 2003, and 35 to 37% CF for projects installed between
2004 and 2007.