
Page 310 - Fluid Power Engineering
P. 310
276 Chapter Thirteen
4,500
Individual Project Cost (283 online projects totaling 18,641 MW)
4,000 Capacity-Weighted Average Project Cost
Installed Project Cost (2008 $/kW) 3,000
Polynomial Trend Line
3,500
2,500
2,000
1,500
1,000
500
0
1982 1983 1984 1985 1986 1987 1988 1989 1990 1991 1992 1993 1994 1995 1996 1997 1998 1999 2000 2001 2002 2003 2004 2005 2006 2007 2008
Source: Berkeley Lab database (some data points suppressed to protect confidentiality)
FIGURE 13-2 Total installed cost of wind projects in the United States. 2
Table 13-1, total installed cost of $2,000/kW is used; the percentages
are for the state of Colorado.
The cost of turbine is the most significant cost of a project. Ac-
2
cording to LBL data, turbine costs hit a low point of $700/kW in
2000–2002; since then, the cost has doubled to $1,360/kW in 2008.
The reasons are: Higher degree of sophistication of the machines
with respect to higher capacity factor, higher degree of grid friend-
liness (LVRT, reactive power compensation, etc.) and higher prices of
2
raw materials, like steel and copper. LBL data suggests a significant
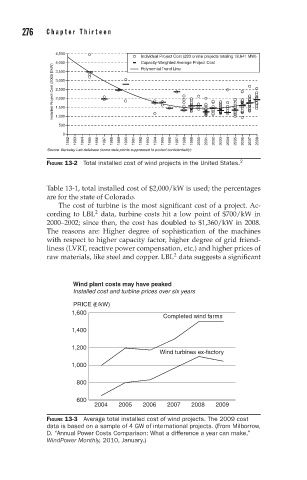
Wind plant costs may have peaked
Installed cost and turbine prices over six years
PRICE ( /kW)
1,600
Completed wind farms
1,400
1,200
Wind turbines ex-factory
1,000
800
600
2004 2005 2006 2007 2008 2009
FIGURE 13-3 Average total installed cost of wind projects. The 2009 cost
data is based on a sample of 4 GW of international projects. (From Milborrow,
D. “Annual Power Costs Comparison: What a difference a year can make,”
WindPower Monthly, 2010, January.)