
Page 227 - Wind Energy Handbook
P. 227
AERODYNAMIC PERFORMANCE ASSESSMENT 201
Actual
power
curve
Wind
turbine Power
power curve
distorted
by binning
Wind
speed
probability
Wind speed
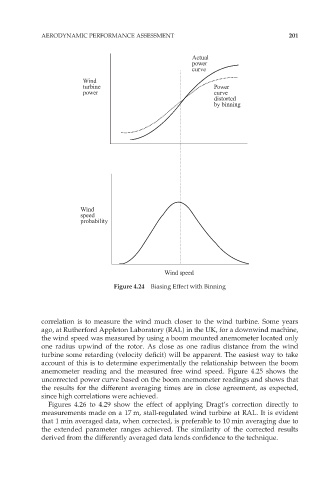
Figure 4.24 Biasing Effect with Binning
correlation is to measure the wind much closer to the wind turbine. Some years
ago, at Rutherford Appleton Laboratory (RAL) in the UK, for a downwind machine,
the wind speed was measured by using a boom mounted anemometer located only
one radius upwind of the rotor. As close as one radius distance from the wind
turbine some retarding (velocity deficit) will be apparent. The easiest way to take
account of this is to determine experimentally the relationship between the boom
anemometer reading and the measured free wind speed. Figure 4.25 shows the
uncorrected power curve based on the boom anemometer readings and shows that
the results for the different averaging times are in close agreement, as expected,
since high correlations were achieved.
Figures 4.26 to 4.29 show the effect of applying Dragt’s correction directly to
measurements made on a 17 m, stall-regulated wind turbine at RAL. It is evident
that 1 min averaged data, when corrected, is preferable to 10 min averaging due to
the extended parameter ranges achieved. The similarity of the corrected results
derived from the differently averaged data lends confidence to the technique.