
Page 223 - Wind Energy Handbook
P. 223
ANALYSIS OF TEST DATA 197
Pulse A/D
counter converter
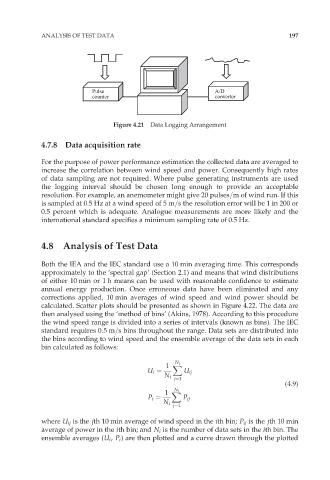
Figure 4.21 Data Logging Arrangement
4.7.8 Data acquisition rate
For the purpose of power performance estimation the collected data are averaged to
increase the correlation between wind speed and power. Consequently high rates
of data sampling are not required. Where pulse generating instruments are used
the logging interval should be chosen long enough to provide an acceptable
resolution. For example, an anemometer might give 20 pulses=m of wind run. If this
is sampled at 0.5 Hz at a wind speed of 5 m=s the resolution error will be 1 in 200 or
0.5 percent which is adequate. Analogue measurements are more likely and the
international standard specifies a minimum sampling rate of 0.5 Hz.
4.8 Analysis of Test Data
Both the IEA and the IEC standard use a 10 min averaging time. This corresponds
approximately to the ‘spectral gap’ (Section 2.1) and means that wind distributions
of either 10 min or 1 h means can be used with reasonable confidence to estimate
annual energy production. Once erroneous data have been eliminated and any
corrections applied, 10 min averages of wind speed and wind power should be
calculated. Scatter plots should be presented as shown in Figure 4.22. The data are
then analysed using the ‘method of bins’ (Akins, 1978). According to this procedure
the wind speed range is divided into a series of intervals (known as bins). The IEC
standard requires 0:5m=s bins throughout the range. Data sets are distributed into
the bins according to wind speed and the ensemble average of the data sets in each
bin calculated as follows:
N j
1 X
U i ¼ U ij
N i
j¼1
(4:9)
N i
1 X
P i ¼ P ij
N i
j¼1
where U ij is the jth 10 min average of wind speed in the ith bin; P ij is the jth 10 min
average of power in the ith bin; and N i is the number of data sets in the ith bin. The
ensemble averages (U i , P i ) are then plotted and a curve drawn through the plotted