
Page 224 - Wind Energy Handbook
P. 224
198 WIND-TURBINE PERFORMANCE
1500
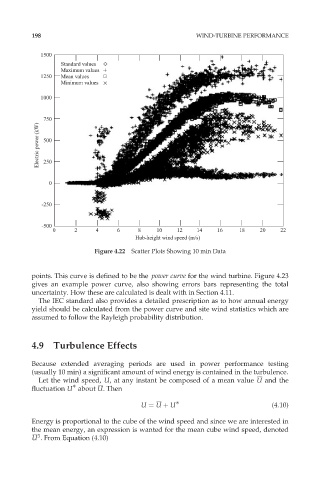
Standard values
Maximum values
1250 Mean values
Minimum values
1000
750
Electric power (kW) 500
250
0
-250
-500
0 2 4 6 8 10 12 14 16 18 20 22
Hub-height wind speed (m/s)
Figure 4.22 Scatter Plots Showing 10 min Data
points. This curve is defined to be the power curve for the wind turbine. Figure 4.23
gives an example power curve, also showing errors bars representing the total
uncertainty. How these are calculated is dealt with in Section 4.11.
The IEC standard also provides a detailed prescription as to how annual energy
yield should be calculated from the power curve and site wind statistics which are
assumed to follow the Rayleigh probability distribution.
4.9 Turbulence Effects
Because extended averaging periods are used in power performance testing
(usually 10 min) a significant amount of wind energy is contained in the turbulence.
Let the wind speed, U, at any instant be composed of a mean value U and the
fluctuation U about U. Then
U ¼ U þ U (4:10)
Energy is proportional to the cube of the wind speed and since we are interested in
the mean energy, an expression is wanted for the mean cube wind speed, denoted
3
U . From Equation (4.10)