
Page 249 - Wind Energy Handbook
P. 249
STATIONARY BLADE LOADING 223
ð
R
1
M max ¼ C f : rU 2 c(r)r dr:Q D (5:16)
2 e50
0
where Q D is a dynamic factor given by
r ffiffiffiffiffiffiffiffiffiffiffiffiffiffiffiffiffiffiffiffiffiffiffiffiffiffiffiffiffiffiffiffiffiffiffiffiffiffiffiffiffiffiffiffiffiffiffiffiffiffiffiffiffiffiffiffiffiffiffiffi
2
ó u ð 2
1 þ g 2 K SMB þ R u (n 1 )K Sx (n 1 )º M1
U 2ä
Q D ¼ (5:17)
ó u p ffiffiffiffiffiffiffiffiffiffiffi
1 þ g 0 2 K SMB
U
There is considerable advantage in starting with the extreme gust speed and
Ð
1 2 R
calculating the extreme root moment as the product of C f 2 rU c(r)r dr and Q D ,
e50 0
because it eliminates most of the error associated with linearizing the formula for
dynamic pressure. For example, if the extreme gust is 1.4 times the extreme 10 min
mean wind speed, as postulated in IEC 61400-1 (which implies that the product
2
g 0 (ó u =U) is 0.4), then the dynamic pressure due to the gust will be 1:4 ¼ 1:96 times
that due to the 10 min mean, rather than 1.8 times as given by the formula
1 þ g 0 (2fó u =Ug).
Example 5.1
Evaluate the dynamic factor, Q D , for the blade root bending moment for a 20 m long
stationary blade under extreme loading.
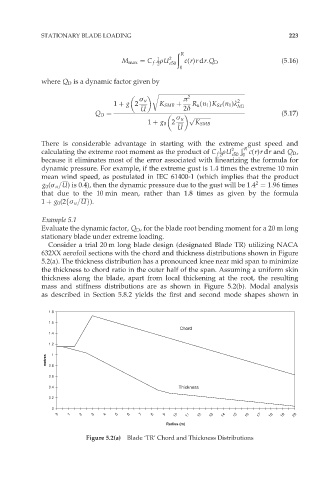
Consider a trial 20 m long blade design (designated Blade TR) utilizing NACA
632XX aerofoil sections with the chord and thickness distributions shown in Figure
5.2(a). The thickness distribution has a pronounced knee near mid span to minimize
the thickness to chord ratio in the outer half of the span. Assuming a uniform skin
thickness along the blade, apart from local thickening at the root, the resulting
mass and stiffness distributions are as shown in Figure 5.2(b). Modal analysis
as described in Section 5.8.2 yields the first and second mode shapes shown in
1.8
1.6
Chord
1.4
1.2
metres 0.8 1
0.6
0.4 Thickness
0.2
0
0 1 2 3 4 5 6 7 8 9 10 11 12 13 14 15 16 17 18 19 20
Radius (m)
Figure 5.2(a) Blade ‘TR’ Chord and Thickness Distributions